Methodology/Score Calculation
Changes starting week ending Oct 16th
A slight tweak to the weighting of the UP or DOWN trend this week, you may remember Oil specialist Lamprell was our leading stock last week
What became apparent is while the methodology weighted the TREND of a stock (i.e Up or Down), it did not account for the margin of gap between the two, and Lamprell was very thin in its margin in this regard, which is something we needed to know. This week, it actually crossed over in Trend from UP to DOWN, which in our system is a significant action and movement.
To balance this, I have now altered the scoring system of this part of the methodology, from simply based on being UP or DOWN, to the percentage gap between them, and included this in our methodology. This change is minimal, but noticeable.
The main changes from this, is that we are seeing a lot more growth stocks coming to the fore, at the expense of the more, low RSI/low average, swing trades.
Average Score
To get the average score, I use a method based around the Ichimoku cloud calculation (Ichimoku - Investopedia)
I have collected the historical WEEKLY data over the last year for every stock.
Weekly data has been chosen to provide a greater base of reliable data, the final figure is collected after the close of the market on Friday, according to the Excel Stock feature.
The calculations include
The Conversion line: The highest, and lowest values, in the last 9 closing periods, divided by 2
The Base line: The highest and lowest values, in the last 26 closing periods, divided by 2
Leading Span A: The Conversion + Base / 2
Leading Span B: The maximum and minimum value, of the last 52 closing periods, divided by 2
In comparison to the traditional ICHI calculation, I have omitted high and low intraday figures.
On a chart, the presence of Line A, and Line B would produce the basic cloud image. We are predominantly looking for stocks with a price that is above the cloud.
The highest figure of the two spans (the top of the cloud), is then used, with the current SP to calculate an average (e.g if the SP is 10, and the highest figure of both A/B is 5, then the average is +100% )
Trend score
If the figure of Leading Span A is above B, we are saying the trend is UP, and if it is the opposite, we are saying the trend is DOWN. Each holding is given a score based on the percentage that they are UP or DOWN, in relation to the top of the ‘cloud’, i.e the highest figure of Leading A or B
So its the Average score + the RSI score + the Trend score, gives the final score, note this is universal for all sectors
RSI Score
The RSI is calculated using the standard RSI method, over 14 previous periods, with the score being calculated in relation to the RSI figure of 70 (overbought)
E.g A holding with a RSI of 70 is a score of 0, while a holding with an RSI of 30 scores 0.57. Anything above 70 is given a minus score.
All rebalancing, will be consistent and will be conducted on the open of the relative Monday morning, this allows the decision making to be made consistently.
Issues
Volume/Liquidity
Some stocks that are going to place high on the rankings, don’t have fantastic volume/spread characteristics, I will need to make decisions on whether to buy certain holdings, on this metric.
I am not trusting the system blindly, each decision will be looked at further.
I also want to avoid using these metrics in the score calculation for now, as I am wary of putting too many variables in play
Fractional capabilities
T212 is not quite there yet with all of the holdings being fractional, and thus going in the pie, so hopefully as time goes on, this will only improve.
In addition, all orders will be market orders.
Methodology
It is not mathematically pure, of that I know. Please feel free, if you think of anything that can help or assist to make the methodology more reliable, but this an admission, that mathematically perfect, is it not.
Nature of the Stock Market
The nature of the market, any external factor can throw everything off course within a moment,
It also must be noted, that as soon as the market opens on Monday morning, the data loses its 100% accuracy, as such this is why data is collected and confirmed on Friday, and looked at over the weekend.
FX
All stocks are subject to fluctuations of the relevant FX rate
Measures of Success
I am simply looking to be profitable every month, and keep losses inside low % ranges
Any profit made at the end of the cycle, will be added into the pie on rebalancing.
The screener was designed to rank and weight stocks based on Growth, and Relative Strength, so that I could implement both mid-long term strategies, and short term (swing trades). I can filter between the two if needed.
Mid-long term
I’m looking to create pies with specific sectors that have a healthy % of promising growth in the figures, in which I have done in the US Tech, and Financial sector, to positive success so far, very early days though! I’ve shared the links below.
To start a pie, I’m looking primarily for + Growth, holdings that are trending UP, with the average RSI below 70 (as an entry point!). There is no maximum amount of holdings, I will fill the pie with as many of the qualifying stocks as I can, up to the 50 permitted. I’m still experimenting in regards to balance %.
I don’t have any LSE pies at the moment, but am looking at Tech and Consumer sectors, as potential in the future, or even potentially a ‘LSE PIE’, in its entirety.
I will aim to review, rebalance and update each Pie on a monthly basis.
Short-term
I’m looking for edges in regards to stocks that have positive growth, but have fallen in regards to the RSI index indicating that there may be an opportunity for a reversal,
You will notice I’ve omitted healthcare completely, as I’m not sure this is the right strategy for the majority of that sector, at the moment, I may run more tests.
I’ve also combined some sectors to add balance (i.e Communications and Utilities, Industrials and Materials), due to depth of the exchange.
Opening note
A slight tweak to the methodology this week! All information included in the methodology drop down
After consideration, I am also going to change the presentation a little, its also apparent that good moves are being lost, by mixing Growth and Swing opportunities, so we’re going to try separate, and filter the two!
Current pies - 2 weeks old
US TECH - equal balance: + 7%
www.trading212.com/pies/l79z8GBLgq0X2ERcRXaXSUSSMcld
US FINANCE - split balance: + 3%
www.trading212.com/pies/l79z8GBLgq0X2ERcQpySz6qhU5n0
Moving on to the week ending October 16th
Top 20 - Avg (%)
| # | Top 20 - Avg (%) | TICKER | SECTOR | AVG (%) | TREND (%) | RSI |
|---|---|---|---|---|---|---|
| 1 | AO WORLD PLC (XLON:AO.) | AO. | CONSUMER | 44.71% | UP: 14.52% | 85.37 |
| 2 | XAAR PLC (XLON:XAR) | XAR | TECH | 32.24% | UP: 23.95% | 74.31 |
| 3 | MIRRIAD ADVERTISING PLC (XLON:MIRI) | MIRI | IND.MAT | 30.11% | UP: 15.72% | 73.85 |
| 4 | Amur Minerals Corporation (XLON:AMC) | AMC | IND.MAT | 29.59% | UP: 6.97% | 61.68 |
| 5 | VICTORIA P.L.C. (XLON:VCP) | VCP | CONSUMER | 29.58% | UP: 10.42% | 72.08 |
| 6 | G4S PLC (XLON:GFS) | GFS | CONSUMER | 28.09% | UP: 12.13% | 70.59 |
| 7 | HALFORDS GROUP PLC (XLON:HFD) | HFD | CONSUMER | 26.75% | UP: 17.37% | 68.76 |
| 8 | LUCECO PLC (XLON:LUCE) | LUCE | IND.MAT | 26.56% | UP: 19.80% | 71.64 |
| 9 | CERES POWER HOLDINGS PLC (XLON:CWR) | CWR | ENERGY | 26.25% | UP: 17.62% | 66.21 |
| 10 | CLIPPER LOGISTICS PLC (XLON:CLG) | CLG | CONSUMER | 26.07% | UP: 17.64% | 78.57 |
| 11 | LAMPRELL PLC (XLON:LAM) | LAM | ENERGY | 25.34% | DOWN: -6.82% | 60.44 |
| 12 | WILLIAM HILL PLC (XLON:WMH) | WMH | CONSUMER | 24.70% | UP: 20.03% | 70.61 |
| 13 | PETS AT HOME GROUP PLC (XLON:PETS) | PETS | CONSUMER | 24.10% | UP: 7.24% | 73.41 |
| 14 | MOTHERCARE PLC. (XLON:MTC) | MTC | CONSUMER | 23.26% | DOWN: -15.79% | 70.17 |
| 15 | 888 Holdings Public Limited Company (XLON:888) | 888 | CONSUMER | 23.09% | UP: 18.63% | 76.14 |
| 16 | BEST OF THE BEST PLC (XLON:BOTB) | BOTB | CONSUMER | 22.80% | UP: 24.43% | 67.24 |
| 17 | TYMAN PLC (XLON:TYMN) | TYMN | IND.MAT | 22.40% | UP: 6.55% | 75.49 |
| 18 | FRONTIER DEVELOPMENTS PLC (XLON:FDEV) | FDEV | TECH | 22.30% | UP: 14.62% | 80.60 |
| 19 | Kainos Group PLC (XLON:KNOS) | KNOS | TECH | 22.04% | UP: 15.37% | 64.88 |
| 20 | GAMES WORKSHOP GROUP PLC (XLON:GAW) | GAW | CONSUMER | 21.77% | UP: 16.39% | 70.40 |
Snapshot figures: All holdings
Trending Up - 197 (41%)
Trending Down - 280 (59%
Average RSI - 50.79
Bottom 10 - Avg (%)
| # | Bottom 10 - Avg (%) | TICKER | SECTOR | AVG (%) | TREND (%) | RSI |
|---|---|---|---|---|---|---|
| 1 | TULLOW OIL PLC (XLON:TLW) | TLW | ENERGY | -85.56% | DOWN: -80.74% | 32.43 |
| 2 | HAMMERSON PLC (XLON:HMSO) | HMSO | RETAIL ESTATE | -82.49% | DOWN: -63.70% | 32.99 |
| 3 | CINEWORLD GROUP PLC (XLON:CINE) | CINE | CONSUMER | -80.55% | DOWN: -59.93% | 31.44 |
| 4 | PREMIER OIL PLC (XLON:PMO) | PMO | ENERGY | -78.19% | DOWN: -60.77% | 29.56 |
| 5 | CAPITAL & REGIONAL PLC (XLON:CAL) | CAL | RETAIL ESTATE | -76.75% | DOWN: -58.88% | 23.53 |
| 6 | REVOLUTION BARS GROUP PLC (XLON:RBG) | RBG | CONSUMER | -76.34% | DOWN: -61.66% | 29.94 |
| 7 | SAGA PLC (XLON:SAGA) | SAGA | CONSUMER | -74.43% | DOWN: -57.44% | 28.97 |
| 8 | CAPITA PLC (XLON:CPI) | CPI | RETAIL ESTATE | -74.10% | DOWN: -67.82% | 33.36 |
| 9 | PETRA DIAMONDS LIMITED (XLON:PDL) | PDL | IND.MAT | -73.25% | DOWN: -67.47% | 39.73 |
| 10 | Stobart Group Limited (XLON:STOB) | STOB | IND.MAT | -71.65% | DOWN: -54.08% | 31.99 |
Top 10 Growth
These stocks are characterised by their average (%) being above -3%, with an RSI below 65 and trending UP
| # | Top 10 Growth | SECTOR | AVG (%) | TREND (%) | RSI |
|---|---|---|---|---|---|
| 1 | DE LA RUE PLC (XLON:DLAR) | CONSUMER | 20.75% | UP: 12.83% | 57.32 |
| 2 | ILIKA PLC (XLON:IKA) | ENERGY | 15.96% | UP: 23.47% | 62.91 |
| 3 | Amur Minerals Corporation (XLON:AMC) | IND.MAT | 29.59% | UP: 6.97% | 61.68 |
| 4 | ITM POWER PLC (XLON:ITM) | ENERGY | 5.63% | UP: 21.75% | 56.24 |
| 5 | FEVERTREE DRINKS PLC (XLON:FEVR) | CONSUMER | 1.82% | UP: 21.32% | 53.34 |
| 6 | Kainos Group PLC (XLON:KNOS) | TECH | 22.04% | UP: 15.37% | 64.88 |
| 7 | CMC MARKETS PLC (XLON:CMCX) | FINANCIALS | 6.80% | UP: 21.32% | 59.07 |
| 8 | PLAYTECH PLC (XLON:PTEC) | TECH | 11.21% | UP: 16.26% | 59.30 |
| 9 | EVE SLEEP PLC (XLON:EVE) | CONSUMER | 7.67% | UP: 20.13% | 59.68 |
| 10 | BHP GROUP PLC (XLON:BHP) | IND.MAT | 0.58% | UP: 10.70% | 49.24 |
Top 10 Swing
These stocks are characterised by having a maximum RSI of 45, and trending UP.
| # | Top 10 - Swing | SECTOR | AVG (%) | TREND (%) | RSI |
|---|---|---|---|---|---|
| 1 | HOMESERVE PLC (XLON:HSV) | IND.MAT | -3.78% | UP: 11.15% | 44.58 |
| 2 | DCC PUBLIC LIMITED COMPANY (XLON:DCC) | ENERGY | -12.40% | UP: 3.89% | 33.49 |
| 3 | YELLOW CAKE PLC (XLON:YCA) | FINANCIALS | -6.45% | UP: 10.53% | 43.69 |
| 4 | DIRECTA PLUS PLC (XLON:DCTA) | IND.MAT | -11.97% | UP: 9.71% | 40.25 |
| 5 | CENTAMIN PLC (XLON:CEY) | IND.MAT | -12.25% | UP: 13.67% | 44.13 |
| 6 | CRANSWICK PLC (XLON:CWK) | CONSUMER | -5.50% | UP: 3.64% | 41.87 |
| 7 | IOMART GROUP PLC (XLON:IOM) | COMMS.UTIL | -4.18% | UP: 6.47% | 44.94 |
| 8 | LANCASHIRE HOLDINGS LIMITED (XLON:LRE) | FINANCIALS | -5.48% | UP: 1.29% | 41.30 |
| 9 | ASSURA PLC (XLON:AGR) | RETAIL ESTATE | -4.04% | UP: 2.32% | 43.52 |
| 10 | SERICA ENERGY PLC (XLON:SQZ) | ENERGY | -11.05% | UP: 3.71% | 40.25 |
Sector specific rankings
| # | CONSUMER - GROWTH | AVG (%) | TREND (%) | RSI |
|---|---|---|---|---|
| 1 | DE LA RUE PLC (XLON:DLAR) | 20.75% | UP: 12.83% | 57.32 |
| 2 | FEVERTREE DRINKS PLC (XLON:FEVR) | 1.82% | UP: 21.32% | 53.34 |
| 3 | EVE SLEEP PLC (XLON:EVE) | 7.67% | UP: 20.13% | 59.68 |
| 4 | OCADO GROUP PLC (XLON:OCDO) | 3.51% | UP: 18.34% | 59.31 |
| 5 | NAKED WINES PLC (XLON:WINE) | 2.21% | UP: 19.30% | 59.29 |
| 6 | DUNELM GROUP PLC (XLON:DNLM) | 9.48% | UP: 15.46% | 62.34 |
| 7 | STUDIO RETAIL GROUP PLC (XLON:STU) | 6.16% | UP: 13.16% | 58.52 |
| 8 | JD SPORTS FASHION PLC (XLON:JD.) | 14.92% | UP: 9.60% | 62.59 |
| 9 | RECKITT BENCKISER GROUP PLC (XLON:RB.) | 1.21% | UP: 9.66% | 53.17 |
| 10 | RENTOKIL INITIAL PLC (XLON:RTO) | 4.23% | UP: 10.97% | 56.96 |
| # | CONSUMER - SWING | AVG (%) | TREND (%) | RSI |
|---|---|---|---|---|
| 1 | CRANSWICK PLC (XLON:CWK) | -5.50% | UP: 3.64% | 41.87 |
| # | ENERGY - GROWTH | AVG (%) | TREND (%) | RSI |
|---|---|---|---|---|
| 1 | ILIKA PLC (XLON:IKA) | 15.96% | UP: 23.47% | 62.91 |
| 2 | ITM POWER PLC (XLON:ITM) | 5.63% | UP: 21.75% | 56.24 |
| 3 | HOCHSCHILD MINING PLC (XLON:HOC) | 10.56% | UP: 11.69% | 57.25 |
| # | ENERGY - SWING | AVG (%) | TREND (%) | RSI |
|---|---|---|---|---|
| 1 | DCC PUBLIC LIMITED COMPANY (XLON:DCC) | -12.40% | UP: 3.89% | 33.49 |
| 2 | SERICA ENERGY PLC (XLON:SQZ) | -11.05% | UP: 3.71% | 40.25 |
| # | FINANCIALS - GROWTH | AVG (%) | TREND (%) | RSI |
|---|---|---|---|---|
| 1 | CMC MARKETS PLC (XLON:CMCX) | 6.80% | UP: 21.32% | 59.07 |
| 2 | NUMIS CORPORATION PLC (XLON:NUM) | 1.96% | UP: 11.22% | 51.51 |
| 3 | DRAPER ESPRIT PLC (XLON:GROW) | 15.48% | UP: 14.34% | 63.44 |
| 4 | LIONTRUST ASSET MANAGEMENT PLC (XLON:LIO) | 0.50% | UP: 10.47% | 51.29 |
| 5 | GCP INFRASTRUCTURE INVESTMENTS LIMITED (XLON:GCP) | -2.33% | UP: 0.52% | 44.62 |
| 6 | BEGBIES TRAYNOR GROUP PLC (XLON:BEG) | -0.25% | UP: 4.34% | 49.37 |
| 7 | THE RENEWABLES INFRASTRUCTURE GROUP LIMITED (XLON:TRIG) | 2.12% | UP: 8.32% | 54.67 |
| 8 | FIDELITY EUROPEAN VALUES PLC (XLON:FEV) | 4.55% | UP: 6.61% | 55.52 |
| 9 | LONDON STOCK EXCHANGE GROUP PLC (XLON:LSE) | 2.97% | UP: 10.16% | 57.46 |
| 10 | 3I INFRASTRUCTURE PLC (XLON:3IN) | 2.76% | UP: 3.81% | 53.04 |
| # | FINANCIALS - SWING | AVG (%) | TREND (%) | RSI |
|---|---|---|---|---|
| 1 | YELLOW CAKE PLC (XLON:YCA) | -6.45% | UP: 10.53% | 43.69 |
| 2 | LANCASHIRE HOLDINGS LIMITED (XLON:LRE) | -5.48% | UP: 1.29% | 41.30 |
| 3 | GCP INFRASTRUCTURE INVESTMENTS LIMITED (XLON:GCP) | -2.33% | UP: 0.52% | 44.62 |
| 4 | CHESNARA PLC (XLON:CSN) | -6.16% | UP: 0.56% | 43.59 |
| # | INDUSTRIAL.MATERIALS - GROWTH | AVG (%) | TREND (%) | RSI |
|---|---|---|---|---|
| 1 | Amur Minerals Corporation (XLON:AMC) | 29.59% | UP: 6.97% | 61.68 |
| 2 | BHP GROUP PLC (XLON:BHP) | 0.58% | UP: 10.70% | 49.24 |
| 3 | CRH PUBLIC LIMITED COMPANY (XLON:CRH) | 7.01% | UP: 12.18% | 55.05 |
| 4 | PAN AFRICAN RESOURCES PLC (XLON:PAF) | 3.33% | UP: 16.83% | 56.20 |
| 5 | ASHTEAD GROUP PUBLIC LIMITED COMPANY (XLON:AHT) | 14.98% | UP: 14.30% | 62.64 |
| 6 | DIALIGHT PLC (XLON:DIA) | 4.79% | UP: 7.48% | 50.81 |
| 7 | KAZ MINERALS PLC (XLON:KAZ) | 8.92% | UP: 14.94% | 59.56 |
| 8 | ROYAL MAIL PLC (XLON:RMG) | 19.44% | UP: 8.65% | 63.35 |
| 9 | RIO TINTO PLC (XLON:RIO) | 2.10% | UP: 9.70% | 52.93 |
| 10 | ROTORK P.L.C. (XLON:ROR) | 6.53% | UP: 7.76% | 56.22 |
| # | INDUSTRIALS.MATERIALS- SWING | AVG (%) | TREND (%) | RSI |
|---|---|---|---|---|
| 1 | HOMESERVE PLC (XLON:HSV) | -3.78% | UP: 11.15% | 44.58 |
| 2 | DIRECTA PLUS PLC (XLON:DCTA) | -11.97% | UP: 9.71% | 40.25 |
| 3 | CENTAMIN PLC (XLON:CEY) | -12.25% | UP: 13.67% | 44.13 |
| 4 | RESOLUTE MINING LIMITED (XLON:RSG) | -9.54% | UP: 8.33% | 44.78 |
| 5 | GULF MARINE SERVICES PLC (XLON:GMS) | -16.90% | UP: 5.85% | 40.73 |
| # | RETAIL ESTATE - GROWTH | AVG (%) | TREND (%) | RSI |
|---|---|---|---|---|
| 1 | LONDONMETRIC PROPERTY PLC (XLON:LMP) | -1.81% | UP: 10.87% | 48.21 |
| 2 | SEGRO PUBLIC LIMITED COMPANY (XLON:SGRO) | 0.66% | UP: 8.23% | 52.24 |
| 3 | TRITAX BIG BOX REIT PLC (XLON:BBOX) | 9.82% | UP: 9.65% | 63.29 |
| 4 | SAFESTORE HOLDINGS PLC (XLON:SAFE) | 4.50% | UP: 4.14% | 55.94 |
| 5 | PERSIMMON PUBLIC LIMITED COMPANY (XLON:PSN) | 1.78% | UP: 0.56% | 52.27 |
| # | RETAIL ESTATE - SWING | AVG (%) | TREND (%) | RSI |
|---|---|---|---|---|
| 1 | ASSURA PLC (XLON:AGR) | -4.04% | UP: 2.32% | 43.52 |
| # | TECH - GROWTH | SECTOR | AVG (%) | TREND (%) | RSI |
|---|---|---|---|---|---|
| 1 | Kainos Group PLC (XLON:KNOS) | TECH | 22.04% | UP: 15.37% | 64.88 |
| 2 | PLAYTECH PLC (XLON:PTEC) | TECH | 11.21% | UP: 16.26% | 59.30 |
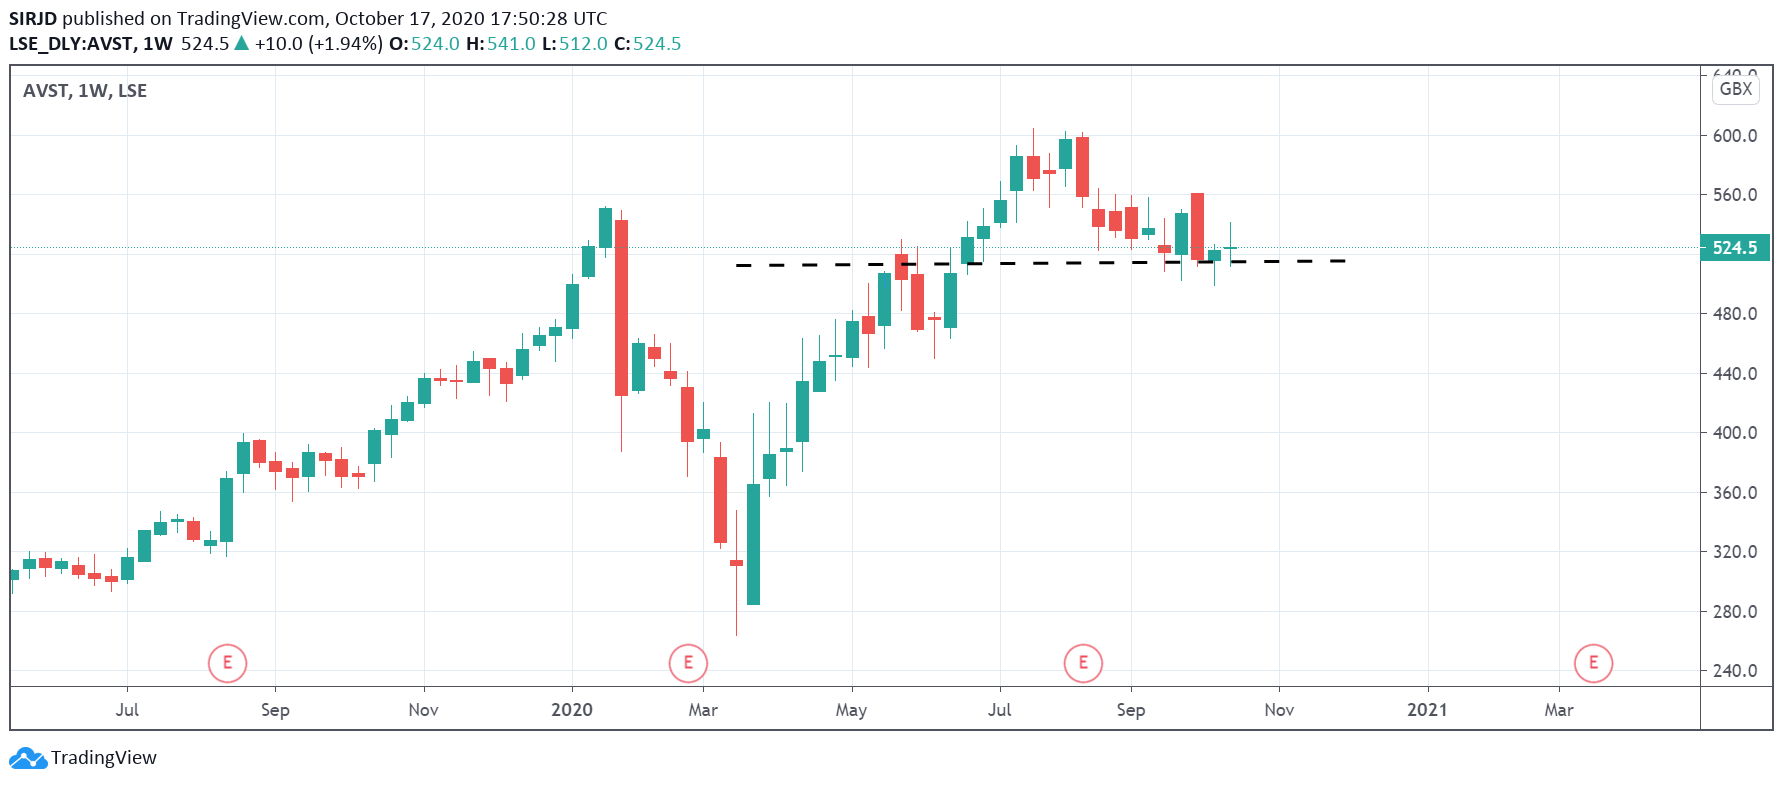
| 3 | AVAST PLC (XLON:AVST) | TECH | -0.72% | UP: 14.09% | 52.35 |
| 4 | FDM GROUP (HOLDINGS) PLC (XLON:FDM) | TECH | 4.68% | UP: 10.97% | 53.98 |
| 5 | CODEMASTERS GROUP HOLDINGS PLC (XLON:CDM) | TECH | 9.39% | UP: 13.92% | 60.70 |
| 6 | ELECTROCOMPONENTS PUBLIC LIMITED COMPANY (XLON:ECM) | TECH | 9.77% | UP: 9.05% | 59.58 |
| 7 | KEYWORDS STUDIOS PLC (XLON:KWS) | TECH | 8.18% | UP: 16.72% | 63.86 |
| 8 | NEXT PLC (XLON:NXT) | TECH | 4.74% | UP: 7.45% | 55.20 |
| 9 | EXPERIAN PLC (XLON:EXPN) | TECH | 10.38% | UP: 7.66% | 59.73 |
| 10 | AVEVA GROUP PLC (XLON:AVV) | TECH | 2.26% | UP: 5.15% | 52.49 |
| # | TECH - SWING | SECTOR | AVG (%) | TREND (%) | RSI |
|---|---|---|---|---|---|
| 1 | LEARNING TECHNOLOGIES GROUP PLC (XLON:LTG) | TECH | -11.36% | UP: 0.33% | 42.27 |
| # | COMMUNICATIONS.UTILITIES - GROWTH | AVG (%) | TREND (%) | RSI |
|---|---|---|---|---|
| 1 | DRAX GROUP PLC (XLON:DRX) | 12.89% | UP: 12.26% | 60.90 |
| 2 | YOUGOV PLC (XLON:YOU) | 9.64% | UP: 16.45% | 64.06 |
| 3 | AUTO TRADER GROUP PLC (XLON:AUTO) | 8.03% | UP: 9.09% | 59.50 |
| 4 | RIGHTMOVE PLC (XLON:RMV) | 10.40% | UP: 7.73% | 62.28 |
| 5 | SEVERN TRENT PLC (XLON:SVT) | 2.97% | UP: 0.74% | 56.13 |
| # | COMMUNICATIONS.UTILITIES - SWING | AVG (%) | TREND (%) | RSI |
|---|---|---|---|---|
| 1 | IOMART GROUP PLC (XLON:IOM) | -4.18% | UP: 6.47% | 44.94 |
| 2 | TELECOM PLUS PLC (XLON:TEP) | -5.16% | UP: 2.31% | 44.37 |
| 3 | TRAINLINE PLC (XLON:TRN) | -15.66% | UP: 1.71% | 39.22 |
Key:
*Avg (%) - defined as the distance (%) between the SP and the top of the ‘cloud’ (Leading Span A/B)
*Trend (%) - defined as the distance (%) between the top, and bottom of the ‘cloud’ (Leading Span A/B)