ASRNL fundamental analysis

Some time ago I came across this interesting stock from the dutch insurance sector. So I’ll share a very short look at it and why I think it’s a decent company going forward. This very short analysis does include the earnings release from Feb 18 2021.


What is ASR and what do they do?

ASR Nederland (I’ll just call it ASR from here on) is a Dutch insurance company that offers financial products mainly in the two categories Life and non-life:

  • Life consists of health insurance and life insurance.
  • Non-life consists of Group and individual pensions, travel, leisure insurance, income protection, Funeral insurance and mortgages

It also Invests in real estate and provides green mortgages among other services like asset management.

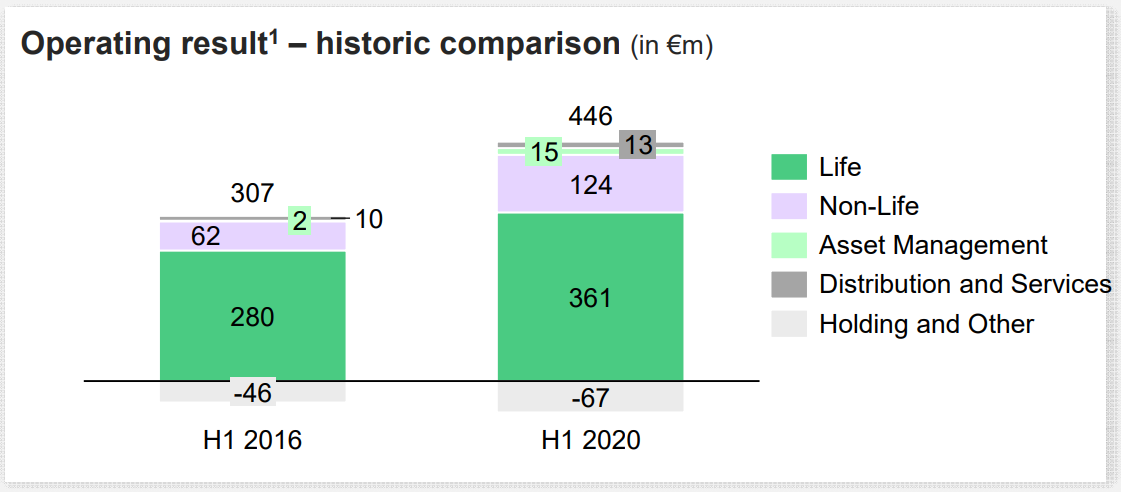
Below we see how the operating result of these operations is distributed.

The all-mighty numbers
When looking at financial institutions pe or dcf analyses become less important. That’s why we will take a look at the ROE, combined ratio, p/b, solvency II ratio among other things.

Almost all insurance companies invest the money from premiums received, that why we will look at ASR in two main ways:

  • Insurance side
  • Investment side

Insurance side
When looking at the underlying insurance business we must look at operating results instead of EBT or net income. Why you may ask? Operating result is EBT - investment income + incidentals.
So it’s a decent metric for looking at how the underlying insurance business works.

For all business lines ASR had decent growth even during covid:

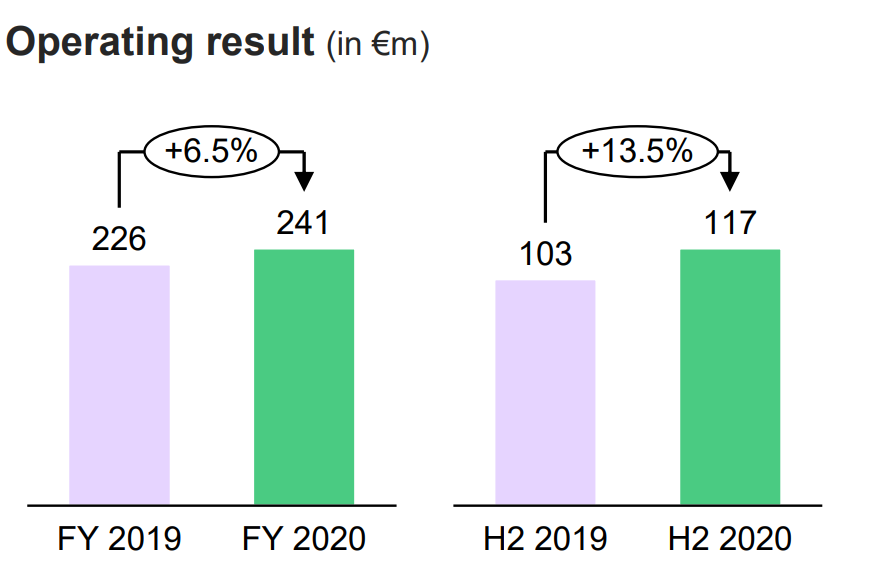
And during covid gross written premiums still increased by double digits (+13.1%) which is a good sign.

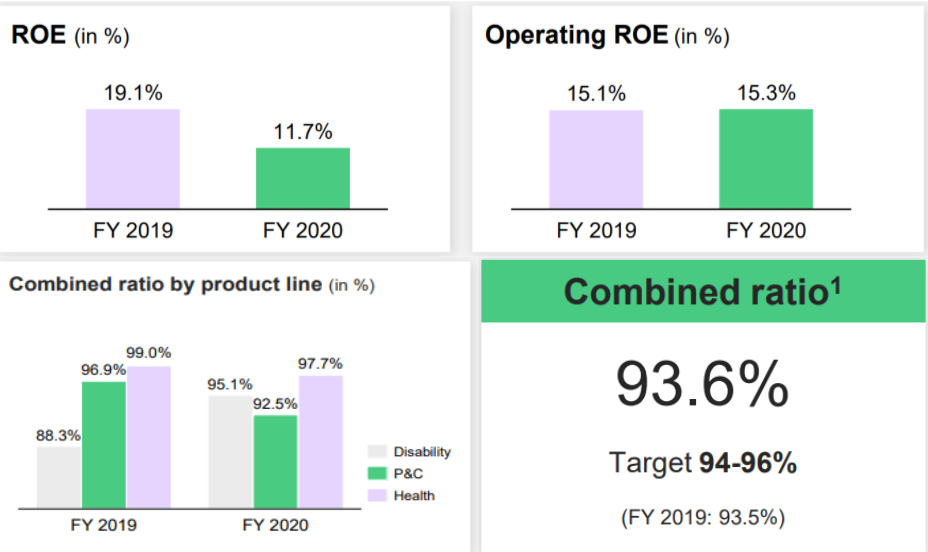
Now let’s look at ROE.
ROE measures the income level an insurance firm is generating as a percentage of shareholders equity, or book value. (the formula is simple: net income/ equity).

We can see that when you include investment returns and incidentals the ROE was very high before covid and took a great hit during covid, but looking at Operating ROE so the ROE of the underlying insurance business we see that there’s still a healthy percentage left which even slightly increased.

The combined ratio is another metric of assessing the insurance side of the business (the formula is also simple: (incurred losses + expenses)/earned premiums) this shows how much money they make from the policies, the lower the percentage the better. Anything above 100% means that the premiums coming in aren’t large enough to cover losses + expenses (this isn’t necessarily bad as a company also makes a lot of money with investing but it’s definitely something to look out for). In general the lower the better.

With ASR we see that the combined ratio slightly worsened during covid with 0.1 percentage point but, per line we see that pre covid lower margin product lines improved during covid and pre covid higher margin lines worsened. Still healthy amounts but worse than American peers like Aflac which have combined ratio’s ranging 70-90%


When looking at insurance companies it might be interesting to look at new business which is a metric which tracks the amount generated from new policies employed. If very high it could show that the company is trying to gain market share by providing new policies (innovative) or that it’s in a competitive market (much competition or disruption), it’s impossible to tell from the number alone though. Luckily I live in the Netherlands and my parents among others have first-hand experience with their policies and I would say that it’s more the first as ASR is one of the smaller insurance companies here with mCap of ~€5 billion and a more transparent, esg and low-cost business model.

One final thing on the insurance side though, their life insurance which is a very large part of the business is fairly stagnant, they have grown it by acquiring smaller insurers and other companies portfolios and have a good track record in doing so. But this is something to be kept in mind.

Investing side
Of course, asr doesn’t only make money from the insurance they also invest a lot.
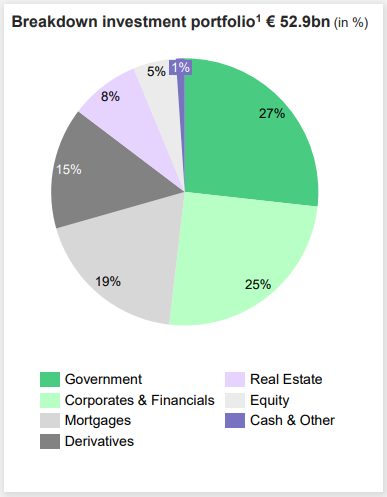
The portfolio is reasonably diversified and the bonds are in the following:
Gov bonds: 0% non-investment grade
Half in AAA
40% in AA

Corp bonds:
80% in A and BBB
15% in AAA and AA
Rerisking will come though so maybe reduced gov bonds and higher equity and corp bonds among other things can be expected.

|311px;x400px;

Company health
image
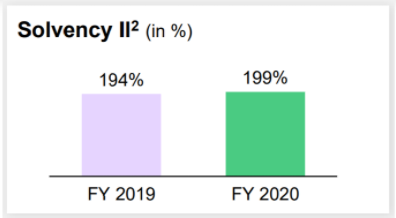
Solvency II ratio is basically a ratio that shows how much own funds a company has in comparison to the regulator’s requirements. ASR has almost twice the required amount which shows that it derisked a bit during covid and handled it very well. This gives room for more shareholder distributions in the form of higher dividends or share buybacks and a re-risking of the portfolio to generate higher returns.

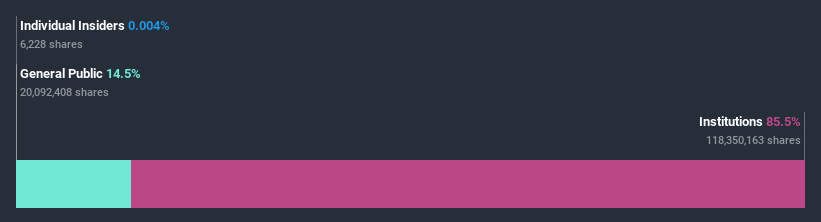
Being just a €5 billion mCap company looking at shareholder might surface some interesting things, but with ASR it did not. The distribution shown bellow is very normal for a larger company.

Share metrics

  • Operating result per share: 7.1% growth
  • Shares outstanding: -2.0% (2019-2020)
  • FY20 dividend raised by 7.4%
  • Share buyback of € 75m announced for 2021
  • P/B of 0.7

All in all ASR is growing at a reasonable but not high rate and imo isn’t priced accordingly.

Disclaimer: I hold about 4 and a half shares of ASRNL with a total value of ~€160, Also own 3 shares of Aflac which also was mentioned

1 Like

Thank you for sharing your analysis @Etypsyno , as with your previous analysis of Salmar and Aedifica this is very interesting.
I noticed that Aedifica was requested last week, a pity that it could not be added, I would have been quite interested :smiley: .

I don’t know much about analysing financials/insurers so I have definitely learnt from your post.
It sounds like a strong business with good stable metrics and some growth.

The only outstanding thing is that we can see that it is a good company, but we probably want to check if it fairly priced, either against the market/its competitors or against its "intrinsic fair value, depending on the investors’ view.
You commented on the ROE, however I guess that this is based on the equity as quoted on the balance sheet and not on the market capitalisation. There is a point at the end of its price to book being 0.7 also. So, I guess my main question would be, how is it valued compared to its price comparedwith its peers or how is it valued compared to its discounted cash flow (potential intrinsic value)?

I learnt what Solvency II and found it very interesting, so I looked for some comparisons, but most of the insurers that I could think of (Axa, Allianz, L&G, Aviva, etc) have not yet issued their financial report so in the end I am just comparing it to the most similar I could find that had presentations and financial statements for 2020, even if no annual report - NN Group (NN). NN is also a dutch company with significant income from the life insurance sector (although likely to be a bit more spread geographically due to size with significant operations in other countries such as Japan)

Note: I am not too familiar with the insurance sector, so I don’t know how similar business models are or how focused they are on Life Insurance. I just searched for insurance companies and had a quick look.

I thought about commenting on Lemonade :smiley: , but I don’t think it does life insurance.

Anyway, I thought it would be useful to compare with another insurer to at least get some market perspective.

Measure NN ASR
Market Capitalisation (Billion euros) 11.6 4.8
Country Netherlands Netherlands
% of life insurance +69 in 2019 (at least*) 80
Solvency ratio (%) 210 (decreasing from 218 and 230) 199
Return on Equity 2020 (%) 4.9 11.7
Return on Equity using 2019 income (%) 5.1 19.1
Operating ROE 2020 (%) 4.9 15.3
Operating ROE using 2019 income (%) 4.6 15.1
Operating growth (%) 9.4 6.5
Price to earnings 2020 6.1 7.3
P/E based on 2019 earnings 5.9 4.9
Price to Book 0.31 0.7

*The forum platform does not seem to allow the “greater than or equal to” sign.

Other notes:

  • NN only provide the combined ratio for their non-life segment which was 95.7% in the second half of 2020, compared to 93.9% in 2019.
  • Values for ASR have been mainly taken from your post, I have only added market capitalisation and earnings

Looking at the comparison we can see that ASR is much more efficient with its cash, having Rerturns on Equity over double those of NN. On the other hand NN seems to be “cheaper” with lower Price to Book values and Price to Earnings based on the latest earnings, as well as faster growth. Regarding this, we would probably have to look at the last 5 to see which company is actually growing more, as it is possible that this figure is due to NN being present in other countries that may have not been as affected by the pandemic. Interesting to see that ASR is very undervalued compared to its earnings if it manages to return to 2019 earnings, the only thing to note is that operating earnings seem to be fairly stable so the two main options I can see for this change is that either they had additional exceptional/one-off income in 2020 or they have had some one-off impact between gross profit and net profit, possibly due to the pandemic. I guess this is likely to be explained somewhere in their statemtents or in the future annual report.

Please do not take it as criticism, just that I think it would be interesting to compare and get a bit of a sector perspective. I would have liked to have compared it against maybe 5-10 companies to see how the sector is doing and how it compares, I am interested in the sector and would consider investing so that would have been helpful for me, but I think I will wait until 2020’s annual reports are out. It’s a sector that seems undervalued and could provide interesting returns in the future.
If anyone has anything to add or comment on this, I’d like to hear your thoughts :smiley: .

And once again Etypsyno, thank you, your analysis have all been very good and interesting.

1 Like

Been waiting since May for it, maybe one day it will be added but on the bright side, Salmar did get added not that long ago.

Indeed it’s also very important to compare it to its peers (which I didn’t really do in the short write up as it’s mostly a qualitative analysis and not really valuation):
In the Netherlands in the whole insurance sector we only have three public companies: Aegon (AGN), NN group and ASR Nederland, really like the table you made :smile: so I just put Aegon in there

Country: Netherlands

Measure AGN
Market Capitalisation (Billion euros) 8.0
Country Netherlands
% of life insurance ***
Solvency ratio (%) 196 (stable)
Return on Equity 2020 (%) 8.5
Return on Equity using 2019 income (%) 9.5
Operating ROE 2020 (%) **
Operating ROE using 2019 income (%) **
Operating growth (%) **
Price to earnings 2020 ~154.4
P/E based on 2019 earnings ~116.8
Price to Book 0.32
Combined ratio (%) 101.7* (vs 90.3 in FY 2019)
* They only provided the combined ratio for Non-Life in their recent report
** Aegon doesn’t provide operating results in their report and presentation
*** They don’t provide a figure for the whole group, only per geographic region, so we would have to sum the revenues and calculate it ourselves

One thing that NN and AGN have that ASR doesn’t is more diversification outside of the Netherlands (although this didn’t prove well for AGN), they also are a bit bigger than ASR.

NN would seem cheapest by p/b, p/e and growth, but I do have to note that ASR derisked it’s portfolio during covid while NN didn’t really do that (explaining the decreasing solvency ratio of NN and Increasing one of ASR). It could be that ASR increases it’s growth a bit when they rerisk it but NN. A major risk with ASR is that their life segments is a bit of a stagnant/declining business but they compensates that thus far by successfully acquiring competitors in the space, most growth for them is in the other insurance business where they’re trying to be a bit of a disruptor.

DCF isn’t as easy with insurance companies I must say because cash flow is more difficult to gauge. This is due to the influence of the investment portfolio, and resulting cash flows on the cash flow statement, which make it harder to gauge the cash being generated from the insurance operations. With insurance, the key determinants are the amount of float that the business generates, its cost (cost can easily be measured using combined ratio) and the long-term outlook for both of these factors. (Warren Buffet Shareholder letter page 8, https://www.berkshirehathaway.com/letters/2000pdf.pdf)

It indeed is a very interesting sector as it provides some diversification with a single investment but going for ASR gives exposure to the Netherlands while NN and AGN have more diversification internationally but personally think it’s best to just get an local one in the region than these ase especially AGN has had very bad international performance compared to their peers

1 Like

Interesting, I will read it.

What did you mean to say here? :slight_smile:
I guess something on a risk. Maybe if their payout exceeds their premium and the return of their investments? I guess this is could happen in a downturn of the stock market or in a stagnant market.

1 Like

I meant that when you invest in an insurance company you’ll also indirectly get exposure to other businesses in which they invested in

1 Like

I was more thinking of the “but” at the end, did you want to add something at the end? A risk maybe?

1 Like

oh just realized haha :sweat_smile:, gonna edit it now

1 Like

Thank you for your analyse

What do you think about American Battery Technology Company ABML?

Thanks

I have never looked at it. I don’t know if maybe Etypsyno has.

Or maybe you want to analyse it and share your thoughts @mp555 ?