would like to propose a new feature that could significantly enhance the investment experience, especially for active and aggressive investors like myself, who want to quickly and effectively analyze companies based on specific financial metrics.
The Proposal:
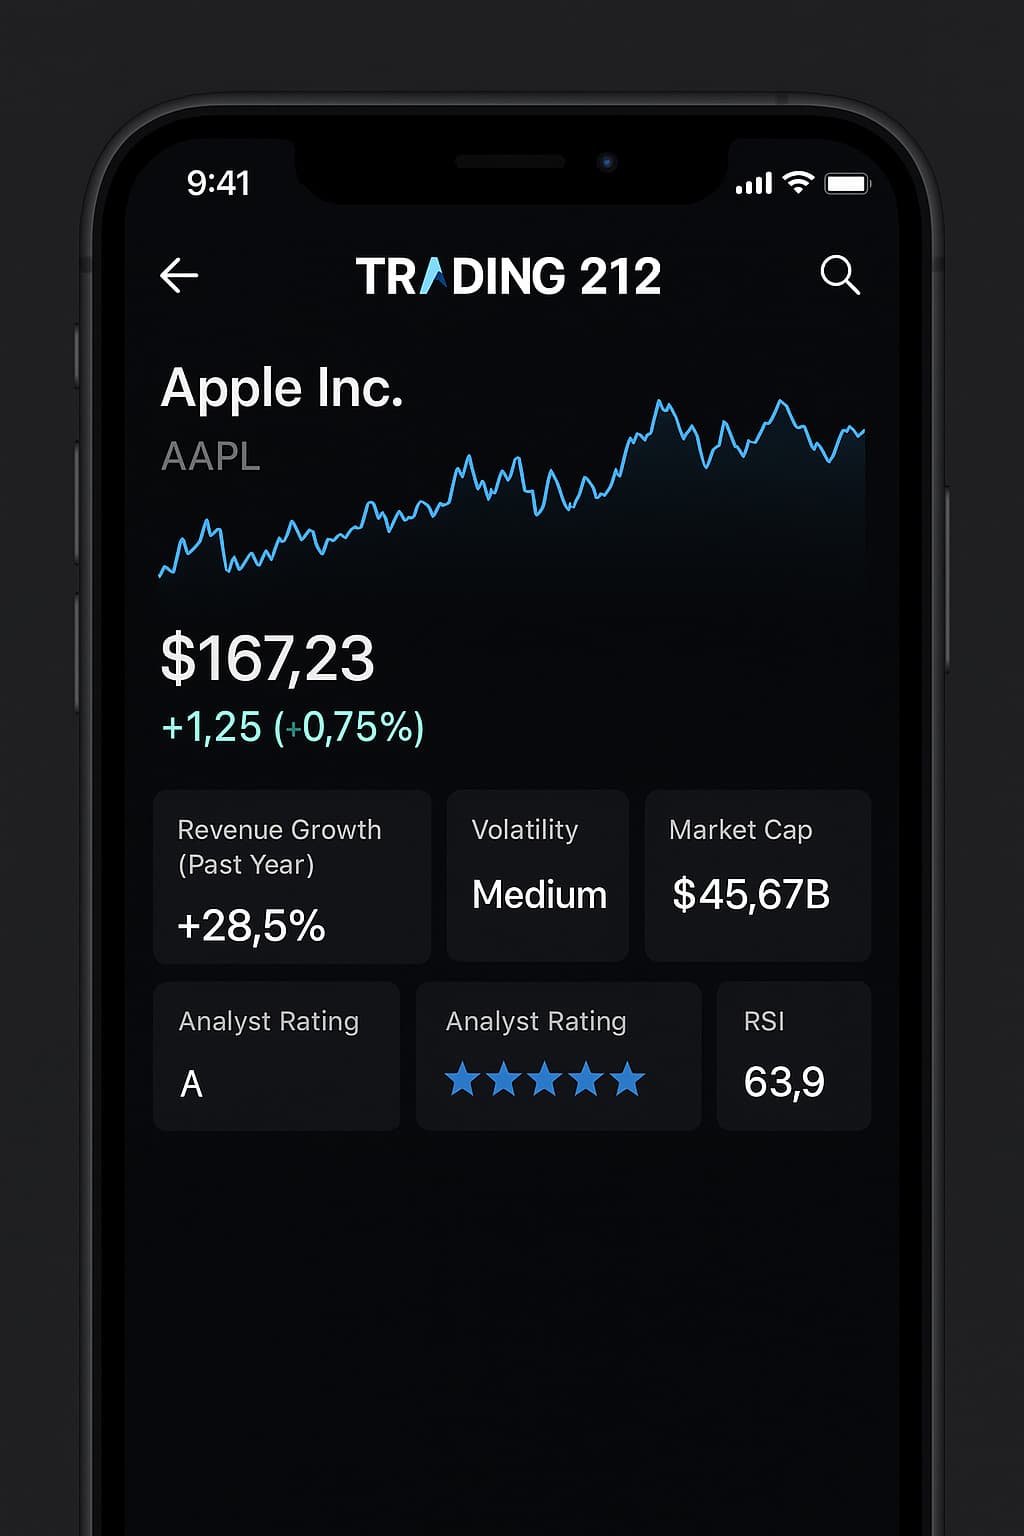
I propose that Trading 212 allows users to display their favorite key metrics at the top of a stock’s information page, stock search field and also add them to the watchlist. This would save a significant amount of time and make it easier to filter and compare companies without having to dig through extensive data each time.
Which Key Metrics:
The following key metrics would be useful to display for an example
- Revenue Growth:
- Why? This helps identify fast-growing companies, which is essential for investors focused on growth.
- Relative Strength Index (RSI):
- Why? It’s crucial for identifying momentum. An RSI above 50 can indicate positive trend movements, while values above 70 may indicate overbought stocks.
- Price to Sales (P/S):
- Why? This is important for finding companies with affordable growth rates, especially in sectors where companies may not yet be profitable but show strong revenue growth.
- Debt-to-Equity (D/E):
- Why? It indicates the financial stability and risk level of a company. Companies with low D/E typically have less financial pressure.
- Total Addressable Market (TAM):
- Why? This is an essential metric for speculative investors who want to see potential in fast-growing or disruptive markets. It indicates the size of the market a company could target.
but there are enough other metrics people can possible use.
Watchlist/ search Integration:
Additionally, it would be great if these key metrics could be displayed in the watchlist. Investors could then easily filter stocks based on these core metrics, allowing them to make the right decisions quickly.
- The watchlist should allow users to customize and add key metrics that are relevant to their investment strategy.
- Users could personalize the display of these metrics to always have the most important information readily available.
Why This Is a Valuable Improvement:
- Time-Saving: It reduces the time needed to manually browse reports and figures. Users can focus on the most important data that helps them make investment decisions.
- User-Friendly Analysis: It makes it easier to understand a company’s position at a glance in terms of growth, momentum, value, and risk.
- Better Decision-Making: It can help traders quickly spot opportunities, especially when looking for companies with strong growth, good momentum, or undervalued stocks.
I hope the Trading 212 team will consider this feature, and I look forward to your feedback and suggestions!