Hi,
A few weeks ago has been introduced a new price alert type: price % change.
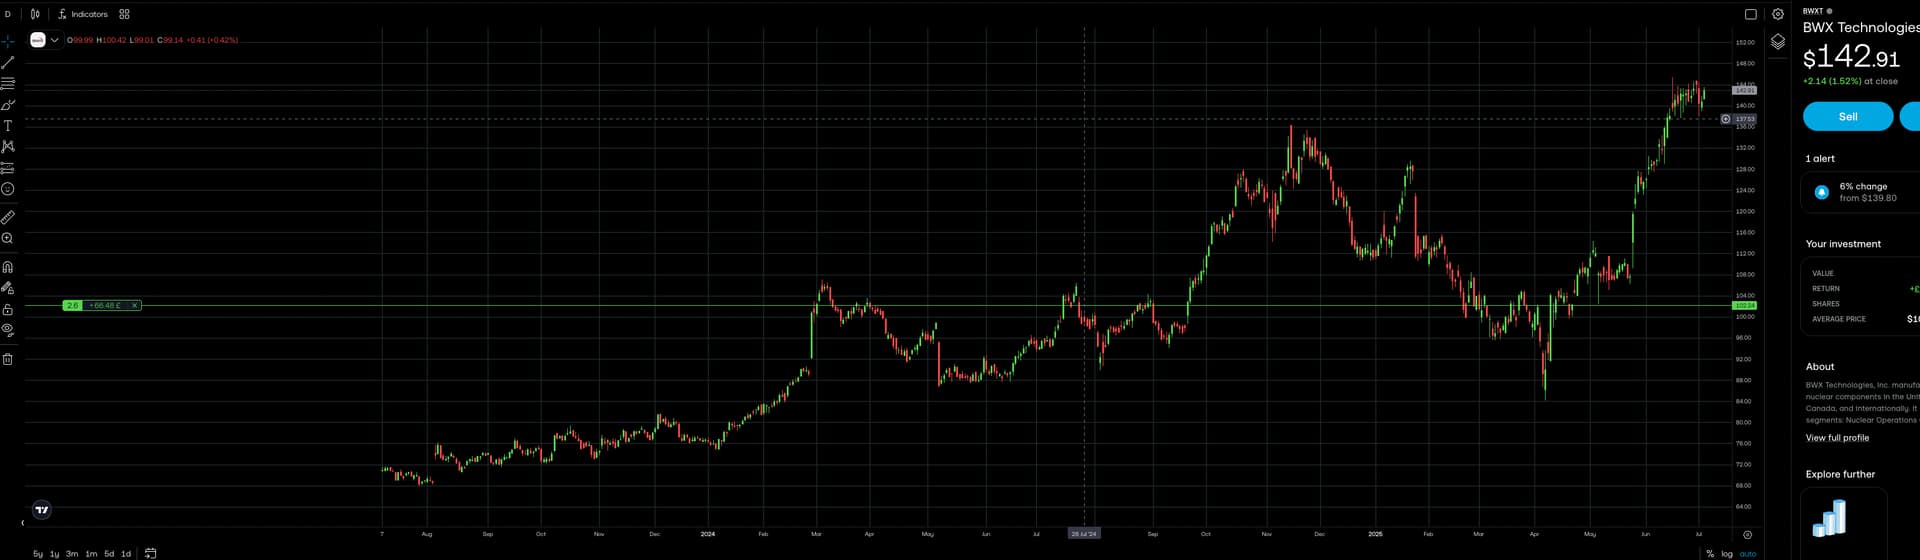
It’s useful but once settled, the “horizontal lines” are not visible in the graphic so the user doesn’t immediately understand if the visualised stock has any sort of alert or not.
Can you make them visible as per classic price target ones?
Regards,
V.
1 Like
One of the reasons for not showing such a line (rather lines) for each % change similar to target price is that the % change could be either positive or negative; where would you show it?
It’s just two lines, though, right?
If i understand correctly, we get alerts of the stock prices goes up or down 10% (or whatever the user selected) from opening price on the day.
So the lines displayed could simply be that: opening price plus and minus the percentage. Then it’s immediately visible when looking at the chat to see if the price has gone over either threshold.
Or if it’s more complicated than that, then it could be that whenever you’re sent a price change alert, a line is created for that alert.