Yeah I am not faulting them for currently not doing as such, what I mean is I would like to keep using T212 long term, however I wouldnt want to need to liquidate large long term holdings so in years to come I would assess if actually I should transfer to a another more professional broker with higher fees per trade.
I love T212 that I can trade fractions and tiny amounts average in, so no going anywhere right now Just hoping it grows with us rather than arguably some recent backwards steps (or standing still at best)
Sigh, no it really doesn’t matter. You can’t claim to have no fees if you have fees - end of. Whether those fees are baked in or listed separately is irrelevant - they are still fees.
I know you want to be helpful to t212 and forum users but you really don’t help matters when you get things wrong!
How the fees are applied is a different matter (important) but not relevant to the “claim”.
I havent looked into it, so apologies for relying on someone here hopefully explaining it to me, but given the huge amount of “commission” already factored in and taken for FX, why is it increasing again? I am not seeing zero charges today, never have since joining. Am i missing something?
Those figures aren’t fees. They show the impact that the GBP/EUR exchange rate has had on your P&L.
In your case, I assume GBP has strengthened against EUR so your Air France shares, denominated in EUR, are now worth more in both EUR and GBP, but the increase in GBP is less because of the exchange rate change. If the exchange rate returned to exactly what it was on the day you bought the shares then the FX IMPACT would be £0.
The FX IMPACT will fluctuate up and down. Most of the time it is just for information purposes, but it will become relevant at the point of sale, because that’s when you’ll realise your true profit/loss in GBP.
You bought 2500 shares at an average price of 4.208 GBP. The current sell price is around 4.413364 (11033.41 / 2500) GBP, so your gain is 513.41 GBP (2500 x (4.413364 - 4.208)). The figure shown is 513.96 GBP, which is close enough.
However, you bought 2500 shares at an average price of 4.723 EUR. The current sell price is 5.144 EUR, so your gain is 1052.5 EUR (2500 x (5.144 - 4.723)), which is about 903 GBP at the current exchange rate. The figure shown is £906.60, which is close enough.
So, if you’d bought the shares at today’s exchange rate, you’d be £906.60 up. However, you bought them when GBP was weaker and therefore had to pay more GBP than you would today. That’s why you’re only £513.96 up. The FX IMPACT is the difference between these numbers: £392.64.
The forex rates taken for the currency conversion on Invest/ISA are taken from the respective currency pair from the CFD account. The conversion rate of each executed order can be checked in the History section of your account.
@David has previously stated that the exchange rates used on the respective currency pairs in CFD are not identical to those used in ISA/INVEST. If I recall correctly, he said ISA/INVEST use a Bloomberg feed.
Note that you have to set the price to 1. I’ve tried repeatedly increasing the quantity by a factor of 10 to reveal more decimal places, but I’m not sure how accurate that is; I’ve noticed a few anomalies.
that is very clever and I was doing similar to have one idea.
But would be very usefull if we can check the exchange rate in a graphic with historical data from few days at least.
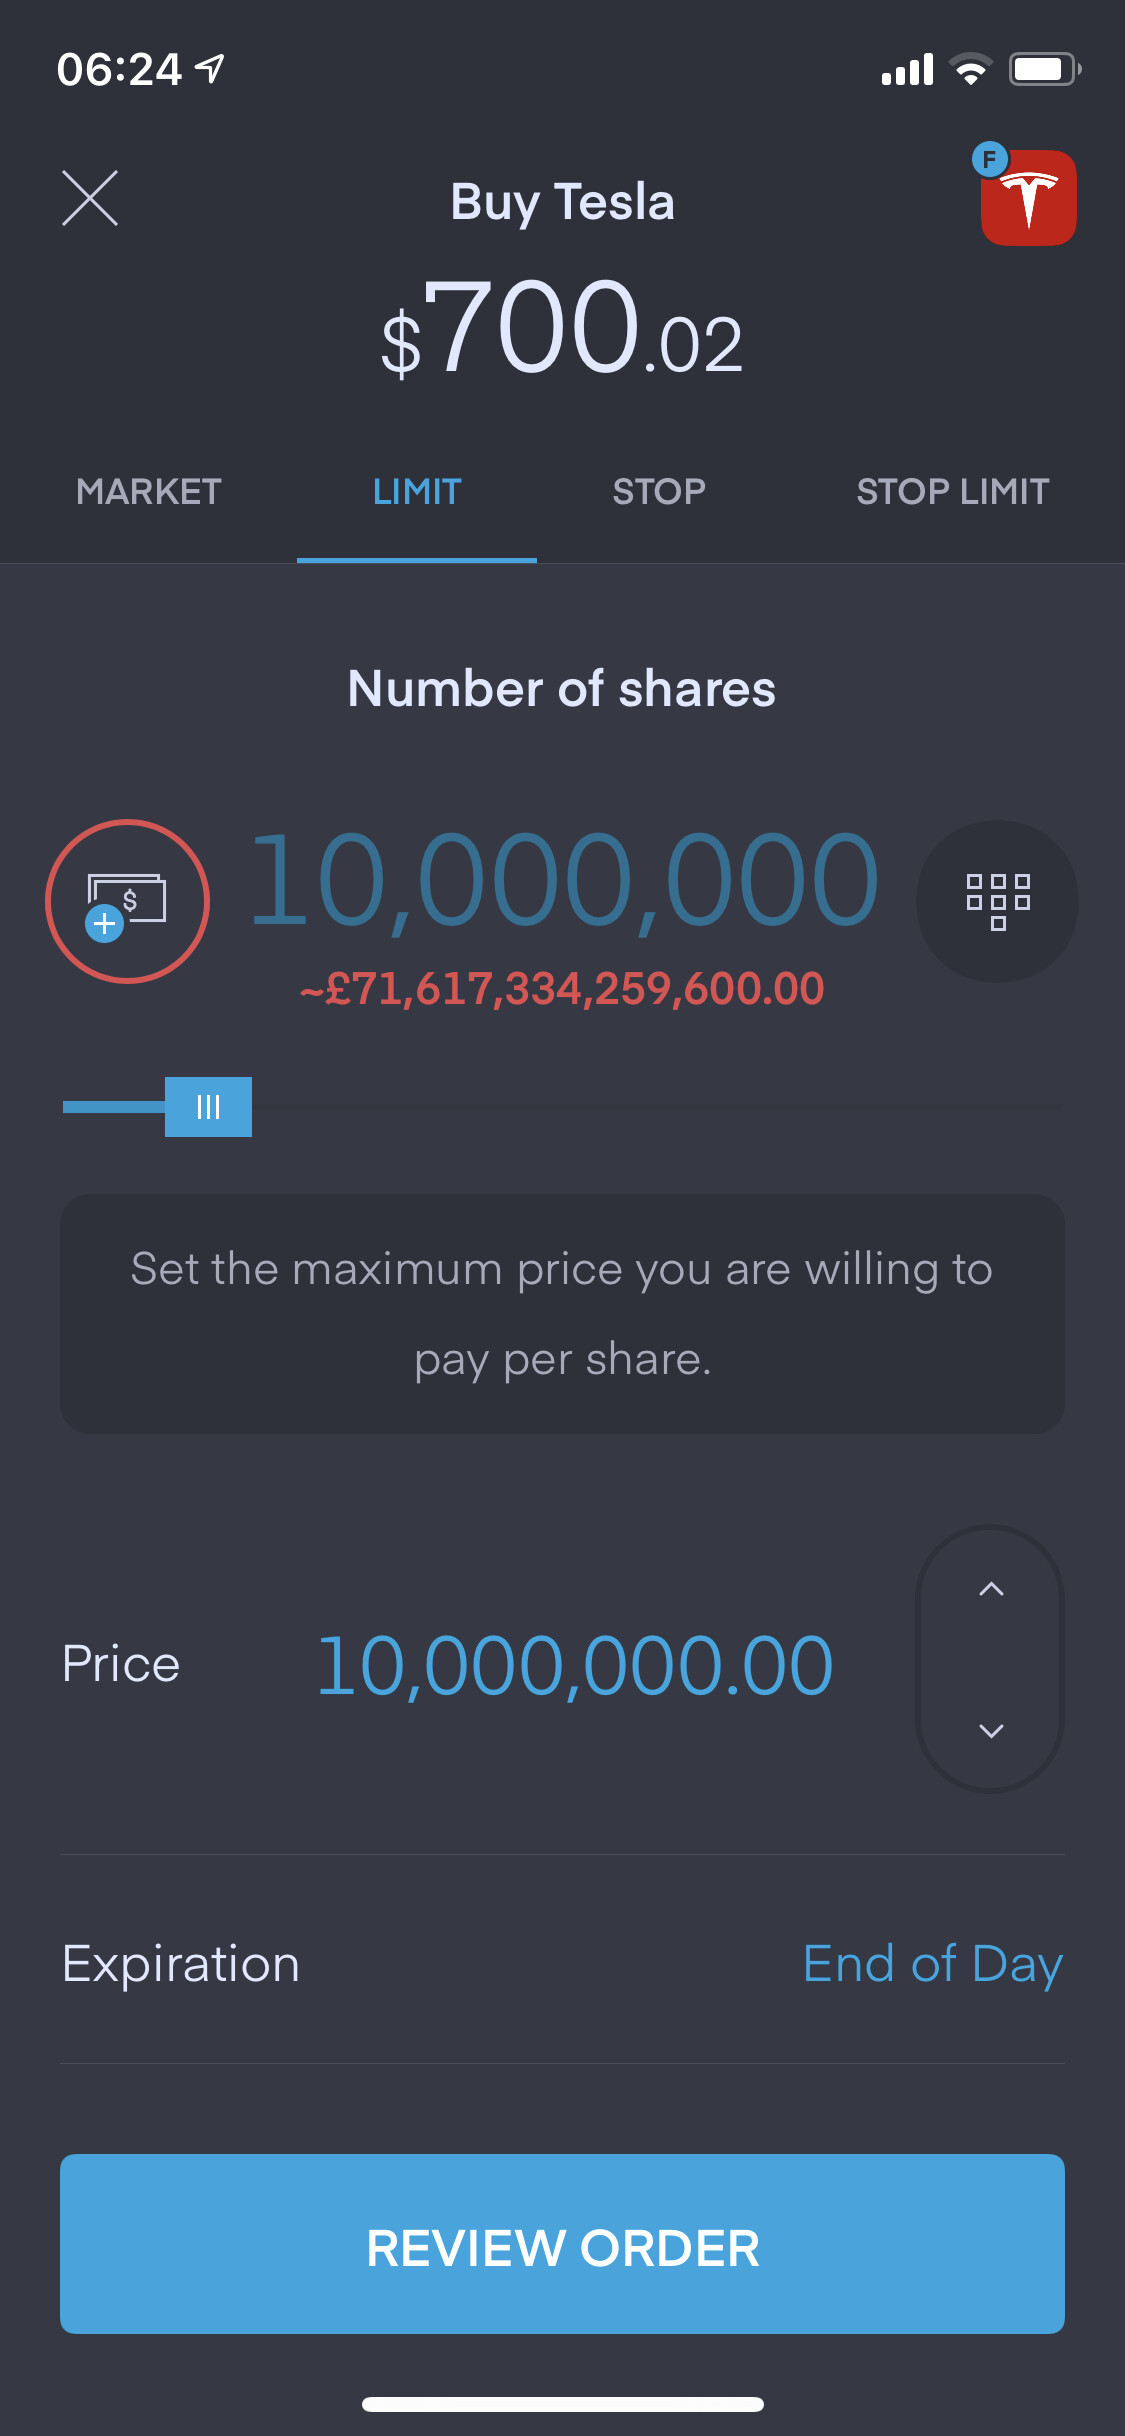
This gives the impression that the exchange rate is expressed to 12 decimal places, for example 0.716173342596, which seems unlikely.
This represents 1 USD = 0.716173342596 GBP.
If I take the reciprocal (1/x) of 0.716173342596, I get 1.396309999999692.
It therefore seems fairly likely that the actual exchange rate used is 1.39631.
This represents 1 GBP = 1.39631 USD.
I’m fairly confident about this, since the exchange rate seems to always be expressed this way, also to 5 decimal places, in the instrument history.
Of course, by the time you’ve done all that, the rate will have changed!
In the future, the spot exchange rate will have been decreased by 0.15% for a buy, and increased by 0.15% for a sell. In this buy example, the true spot rate would be 1.39631 x 100.15% = 1.398404465. For a sell, the true spot rate would be 1.39631 x 99.85% = 1.394215535.
 Just hoping it grows with us rather than arguably some recent backwards steps (or standing still at best)