Hi, It happened again… your chart tanked my trade on Razer(1337.HK) and hit stop loss without it being reflected in any of the other charts and closed my trade… Kindly update your ridiculous Charting API and also refund me my money and the loss I’ve taken due to you incompetent system.
Not saying their is no issue however there’s three big differences, the spread is wider on CFD so it won’t show externally. Third parties won’t know what it is.
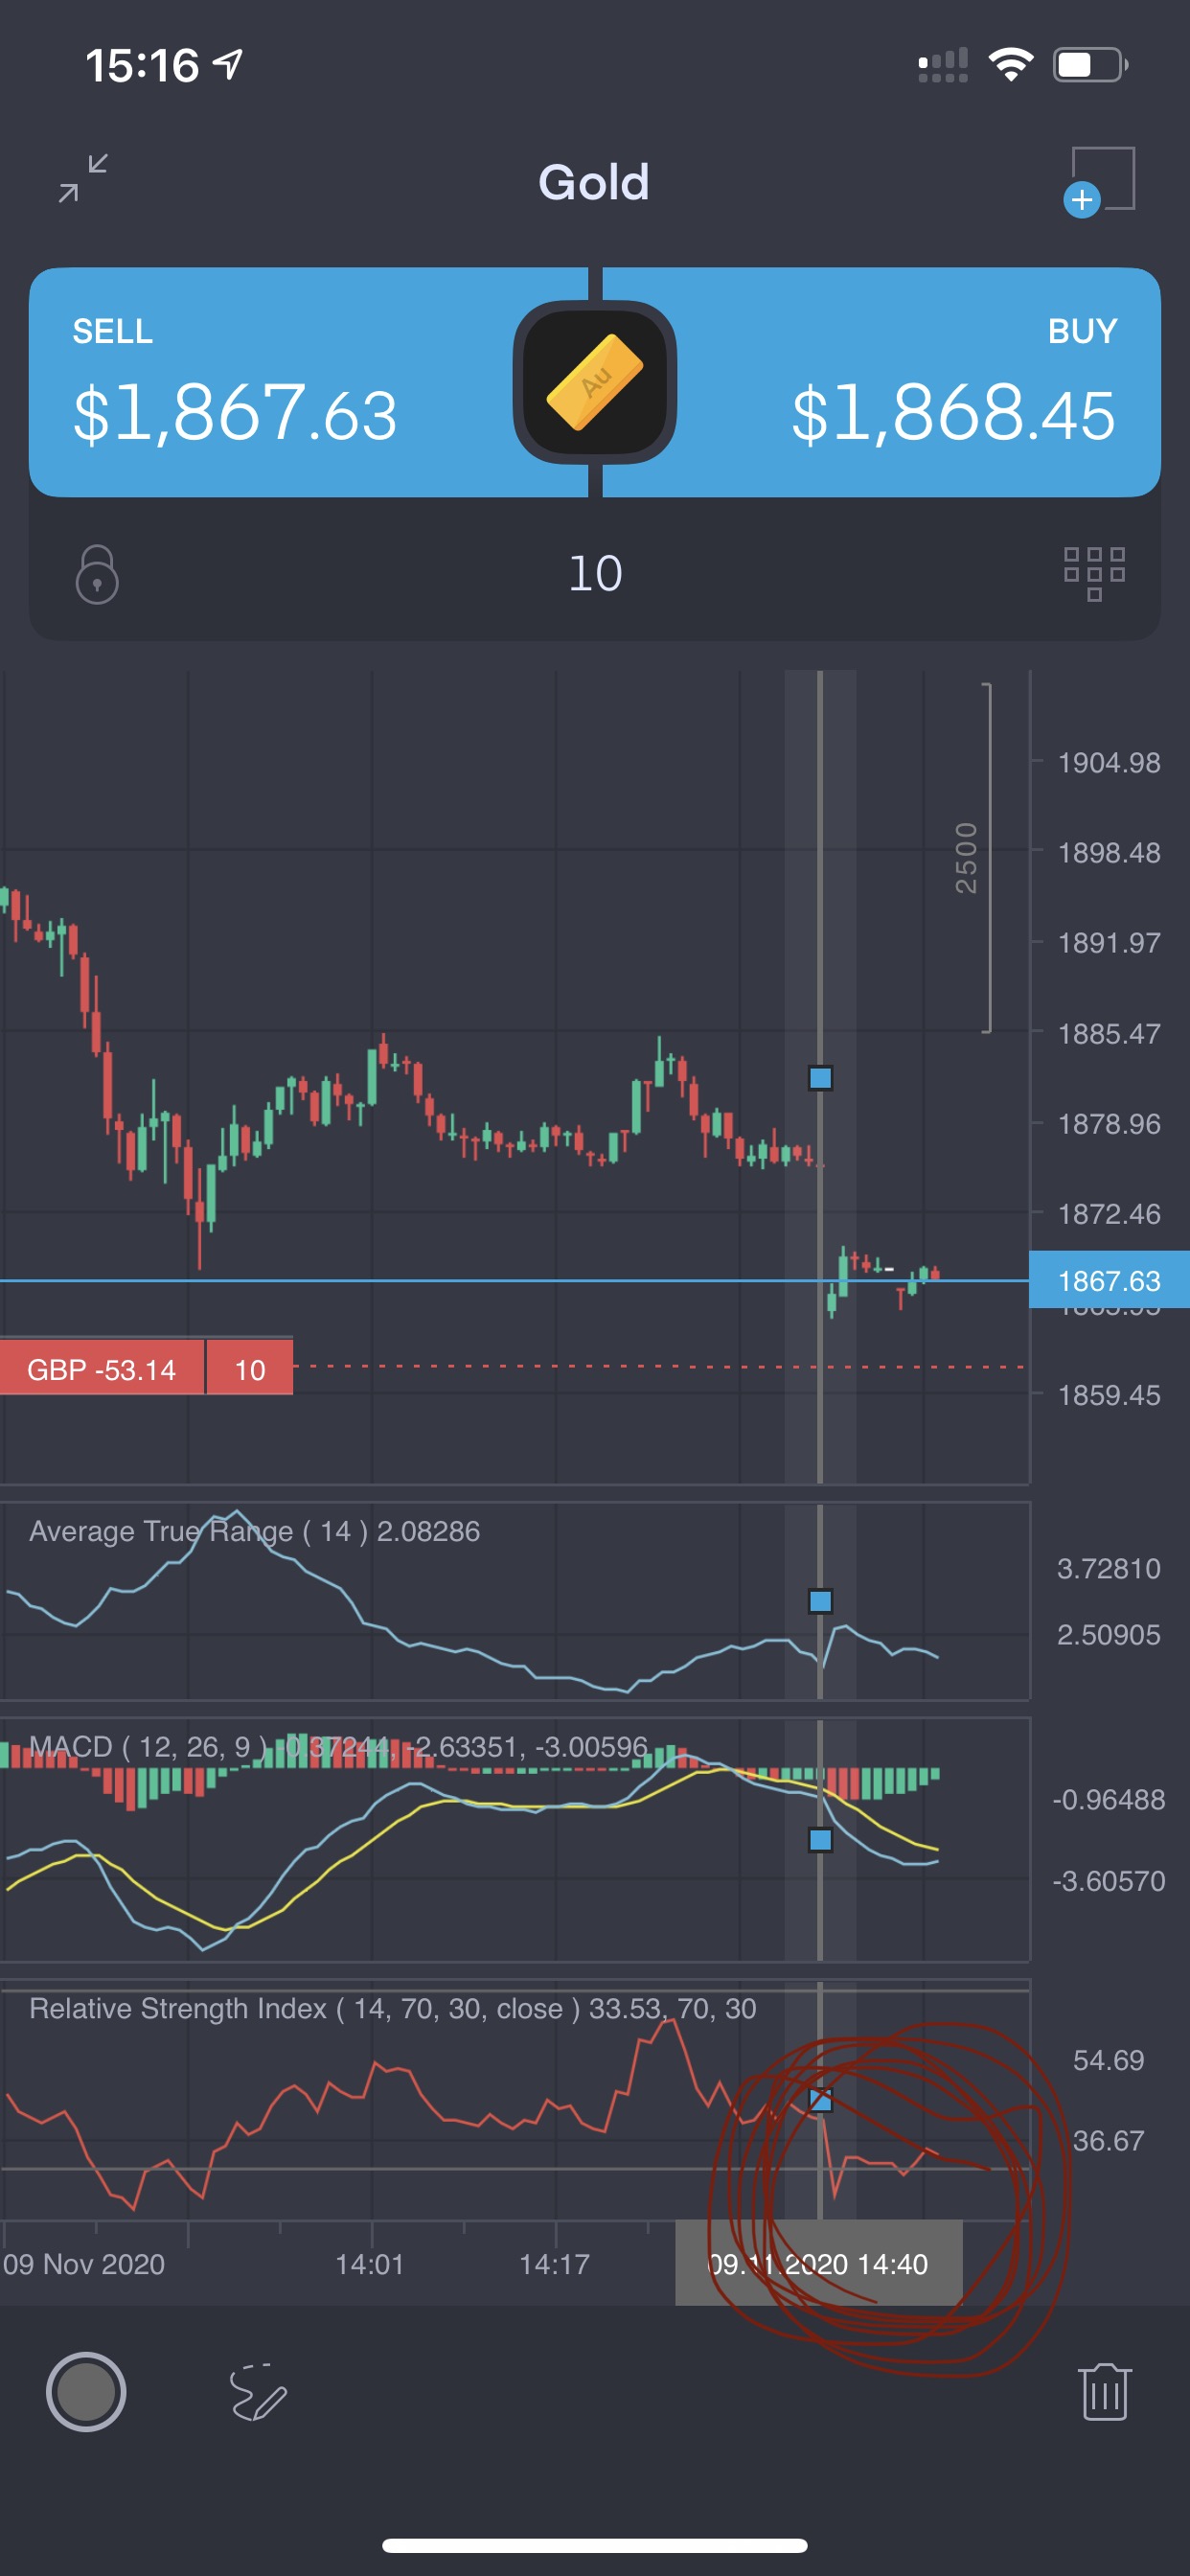
The other is that you are looking at the BID chart in T212 and comparing that with trades in the other charts so not a direct comparison.
Thirdly you appear to be looking at daily and hourly in the T212 screenshots. But then weekly and 2hrly in the external, so they won’t look similar.
Correct the spread is generally wider, but it’s gone bonkers now. I know you don’t do CFDs so may not be used to what the usual spread looks like, but have a look for yourself at some UK stocks this morning. Fees have gone up also.
What I’m saying though is you wouldn’t get the CFD values appearing outside of the T212 platform it’s their spread being applied to it.
The external sites are showing trades not plotting the BID so I would expect them to look different.
There could well be an issue you’ll need to get a staff member like @David who can confirm what the Bloomberg terminal is showing happened at that second.
If there was an issue then they pay out for their mistakes.
@pipo but this isn’t about the spread fees, this is just checking was that drop in the BID real.
I haven’t opened up CFD to check but if you switch to 1min candle it might be clearer what went on within that 1hr candle.
@SnowKry I don’t know if you are affected but there’s a thread here
Guess its just my luck then, cause for Razer stock it didn’t even go below 2.61 intraday and i got slapped with a loss due to this tank that came out of nowhere. no wonder my friends are moving to Tigerbrokers instead of using this platform
Hi @PeterA, Received with thanks, but I would strongly suggest getting your team to check on the charting system as this is not the first time it has happened.
The chart has different bugs that need urgent review. Just to name 2 issues that have become daily issues:
Price starts jumping and showing future ghost bars. It looks like the chart is anticipating the price. Take a look at the Undefined at the bottom of the screen


 review. Just to name 2 issues that have become daily issues: