This may already exist (and therefore not be a feature request), apologies if it is the case.
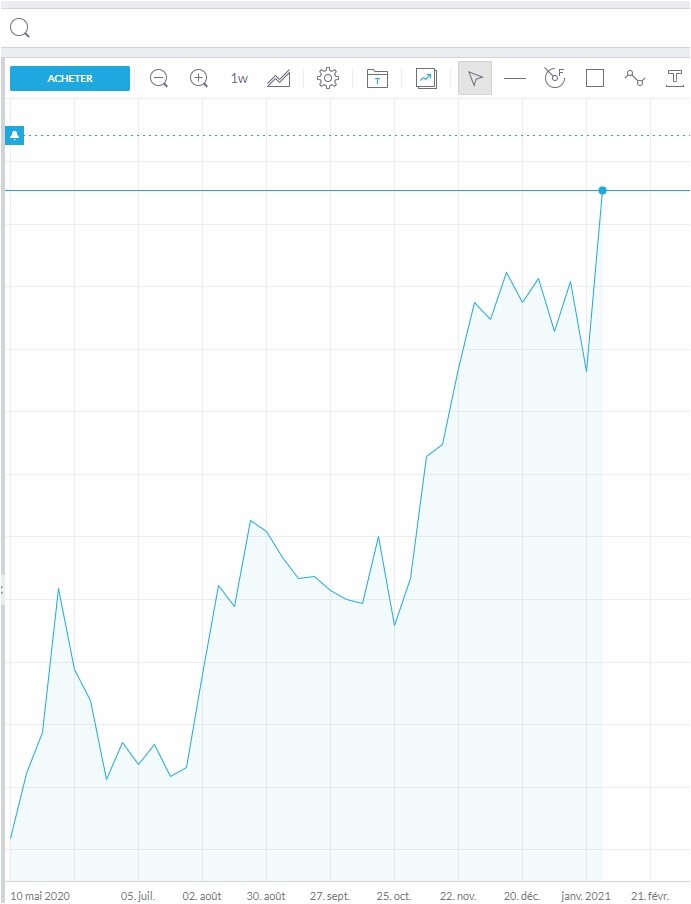
I am used to stock charts on the internet, where you can select “1week” “1 month” “1 year” etc. Trading212 stock chart on the PC screen is different from what I am used to, it seems that the time frame is 3-4 months and fixed.
How can I zoom / de-zoom the time axis? ie look at “all time” chart, then look at the stock price for the previous week.
How can I make the y-axis (stock price) fixed and starting from zero ? I don’t like the fact that the y-axis auto-adjusts when I scroll the time axis. You kind of lose notion of the trend.
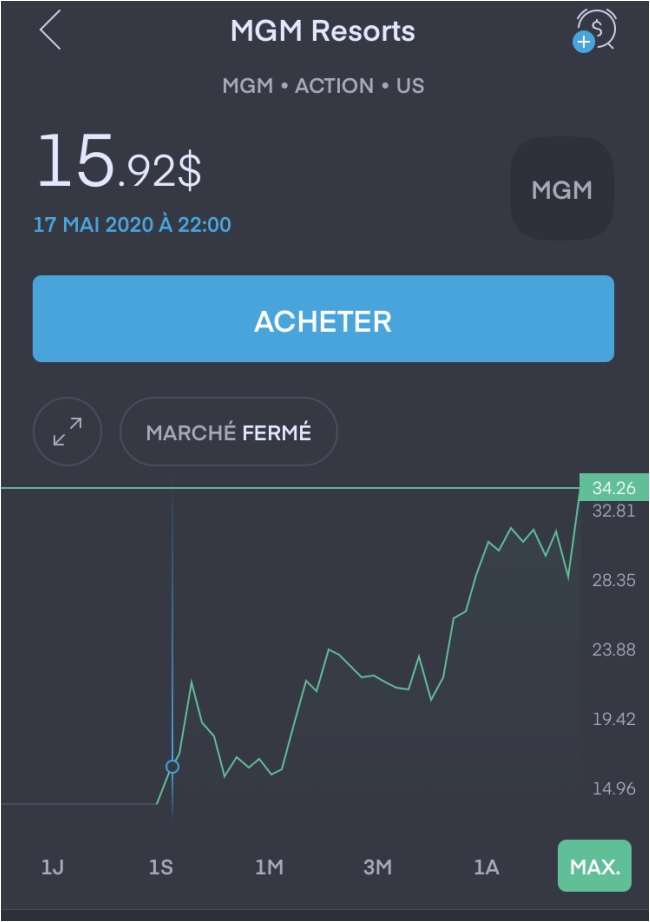
On the app, I can select 1d / 1w / 1m / 1y / MAX to visualize past stock performance, however on the web it does not seem to work like that. Am I missing something?
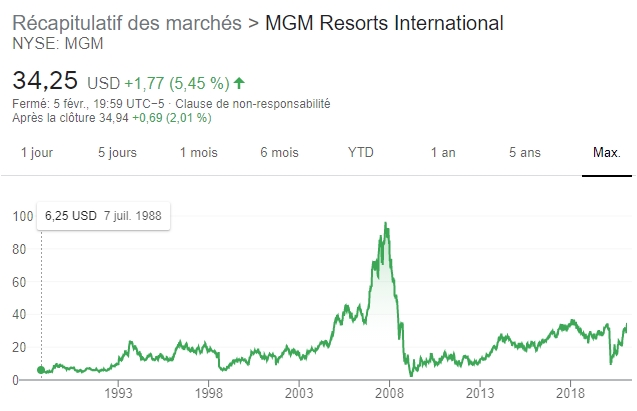
T212 can only display a history for stocks on the basis of the information they hold or are provided.
Often this means that the earliest you can check the graphs on the platform is when the stock in question was added to the platform rather than when it was publicly listed.