Is the invested and return figure at the top of the screen, the return on your current stocks or is it an overall profit / loss figure including dividends and previously sold stock?
Basically if I were up £1000 on the green return figure and I sold all of my stocks, would it show up as 0.00 invested and £0.00 return or would it keep a track of the £1k made before?
Actually in investment this is not a stupid question at all and there are quite a few different definition of “return”
While some of them are very basic “Sausage out/pig in” ratio, many others incorporate the timing and amplitude of the investments. The figure displayed in T212 is… plain meaningless and actually even wrong, not even able to display the correct “invested” amounts.
Cant say I pay that much attention as track offline, but it basically represents the current unrealised gain/loss of your current investments, unadjusted for corporate action events?
Same here, I track offline. I can’t end up with the figure T212 displays no matter what I do. It is weird like if I have 100$ buy stock A sell it for 200$ it shows 0% “return” which again, yes unrealised at this time is 0% but it again is meaningless. the “invested” number is 100% wrong, it displays quite a bit more than what I can possibly contribute to an ISA. (even when I thought they were adding dividend payments to invested.)
its not that the number is incorrect, its that it’s misnamed,
“invested” takes the cash spent on your open positions, it’s not tracking your deposited funds at all, so ISA limits don’t matter. as soon as you close and collect your losses or profits that number then drops to match your current open positions and once you open another position all the money you have just “invested” (spent) is added onto the total and it tracks the current share value against your purchase value.
it’s currently set so that its only ‘correct’ for people who add to their positions but NEVER close to realise the gains. it also means you see big spikes or dips in the graph that aren’t due to share price fluctuations, rather you adjusting your open positions.
there have been requests for it to be adjusted to track deposit’s instead of cash spent on shares for simplicity.
Yeah it’s not wrong, it’s actually correct but just not displaying what you want it to. I checked mine again, and ‘invested’ is the total purchase value of what you currently have invested. It’s your bookcost of securities. Return is your unrealised gain loss. Yours is potentially a lot higher as you’ve made some good investment decisions or been lucky to purchase some stocks previously and sold out at good gains.
There is another thread somewhere where they are looking to add options for anyone that would like to see something different.
What I do offline across platforms, is unitise much cash deposits, so I can compare my return against an index. It sounds like that is what you would like it to do.
Me, personally, I honestly genuinely don’t mind what ever it displays And even if it displayed a few numbers that I myself designed, it still won’t be enough since I hold different accounts on different places. I cannot expect my broker to be my bookkeeper as well.
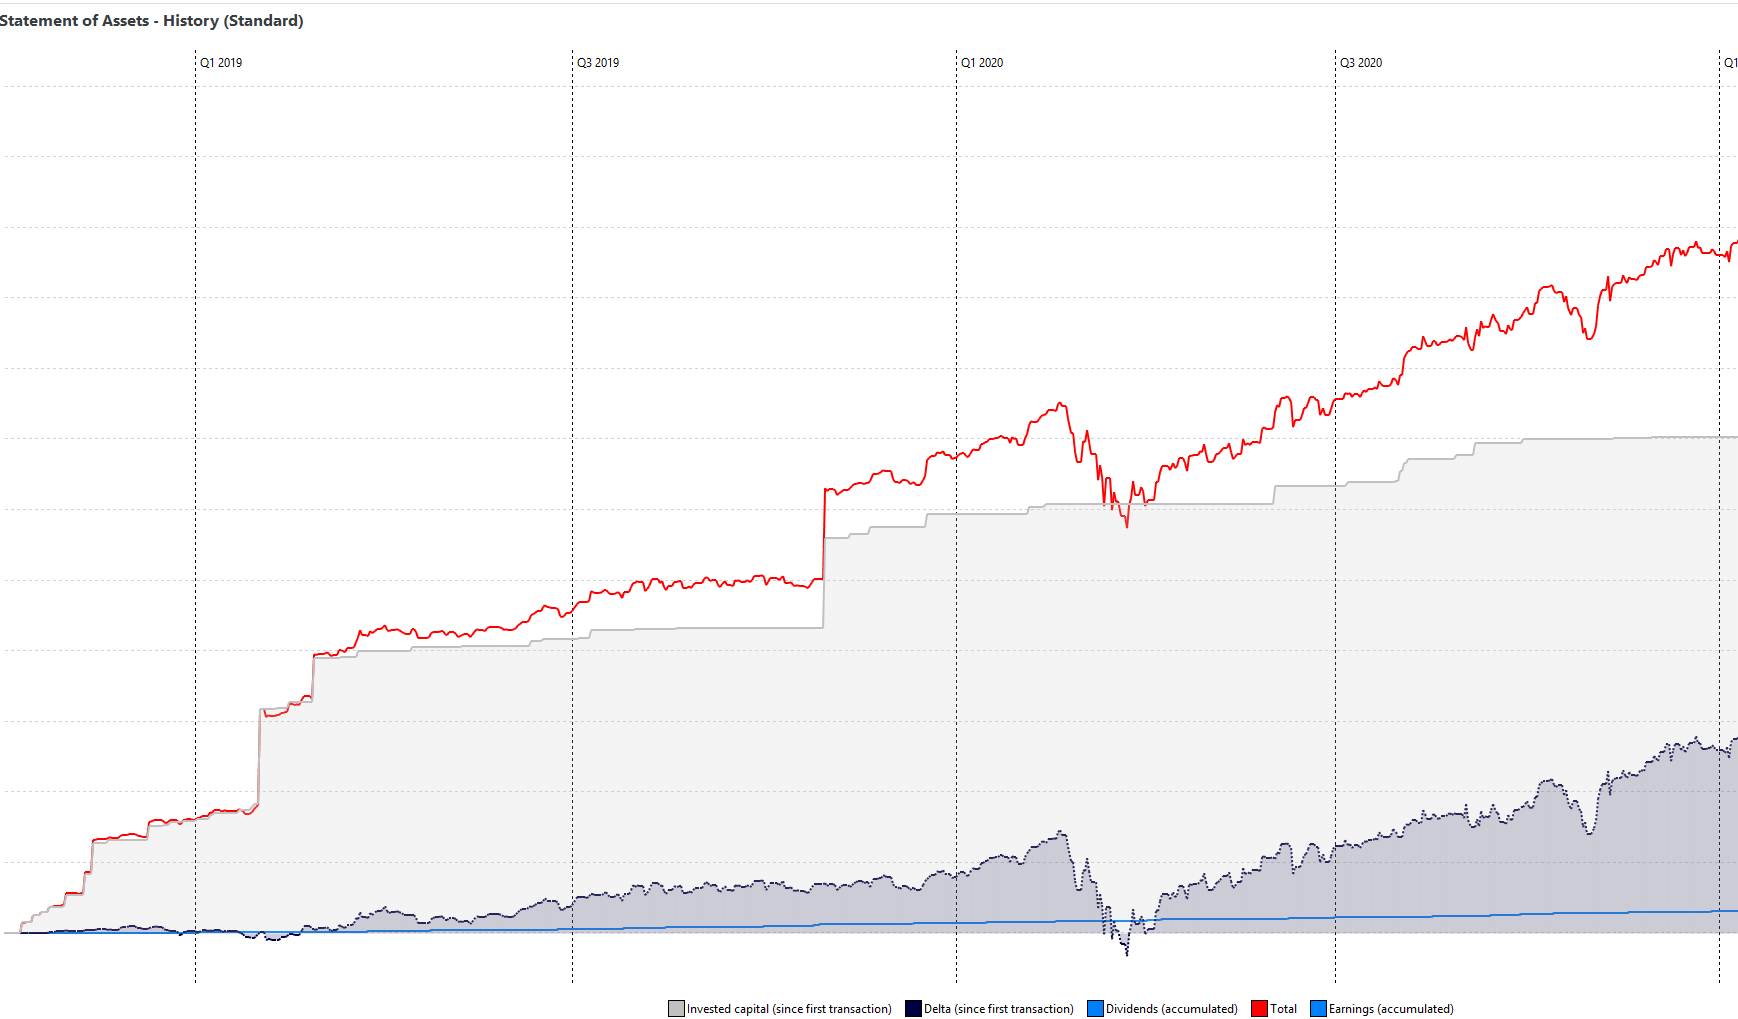
My favourite “single number to tell a meaningful story about your investment” is TTWROR (or XIRR) and like yourself I use “portfolio performance” to plot my portfolio vs a few benchmarks (SnP, NASDAQ etc) It also keeps track of things like “money in” or “taxes paid” etc. so quite handy.
It is a big “chunk of numbers” that takes a while to do initial setup (creating all instruments etc) but after this initialisation it becomes mandatory to use Browse around in the “sample portoflio” it comes with to understand what it can do, before creating your own.
Almost every chart I paste in this forum are from Portfolio performance.
I used to do similar with excel, before finding portfolio performance but it is very difficult to do benchmarks. A benchmark buys a benchmark equity when you inject money into your portfolio, so you cannot just slap the graph of some index and call it benchmark
I think you can if you unitise your own investments correctly. I do that in google sheets but it’s a bit more complicated/better than the version I’ve shared as a proof of concept.
I don’t know what “unıtise your investment” means may be you have a technique here that simulates time lined bookkeeping. So I’m gonno refrain from commenting on it.
So when we use something as benchmark, we want to buy that benchmark when we buy our instrument as well. As we both know timing matters and when you say “10K$ invested in CQQQ vs QQQ in 2020” buying that 10K worth of equity in 01/01/2020 vs buying it in 12 different instalments every month will produce vastly different outcomes.
 your friend with that one!

 Browse around in the “sample portoflio” it comes with to understand what it can do, before creating your own.

 bring on the toggle button