AH being after hours? 
Dipped a toe in and I’m back in the game!
Yeah. Quickest way is google NASDAQ:GNUS.


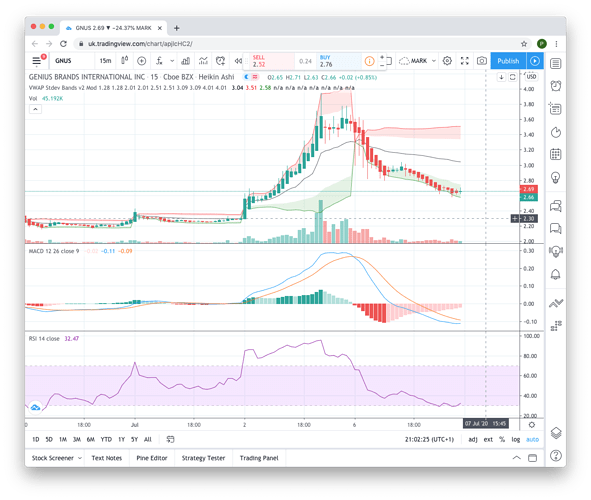
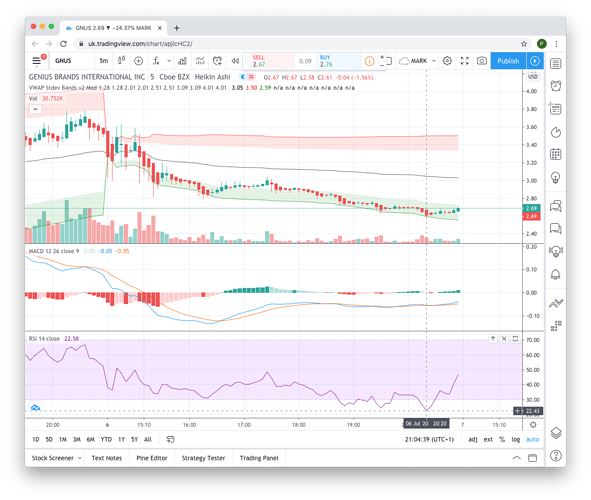
Looking at the charts its show go up on a normal day, very over sold and MACD just about to cross over. I won’t be surprised if it falls back to that 2.30 again.
15m
5m
Ah I see! I never noticed “AH” before.
I presumed closed meant closed. So it only happens after lots of volume sold through the day?
It’s already showing red  so it’s dropped more! And more whilst I’ve been writing
You have Pre-market, then the market opens, then closes, then after-hours. Most traders however stick to the standard US market hours 2:30pm-9pm (UK) as you’ll get much more liquidity and volume.
Expecting a bit of a gap down 2.32 atm.

Not going to be a great day if you are holding

How do you know it’s oversold? Because the candles are in the green zone? What can you do with the information that it’s oversold?
The black line is VWAP ( Volume Weighted Average Price), and on a normal day, where people aren’t selling on news, the trading will usually return to it throughout the day. The red area means its over bought and is due a pullback, the green is over sold and usually means buy once you see it returning.
With RSI again if you see it poking above 70 its also signally over bought (a signal to SELL), and below 30 over sold (a signal to BUY)
With the MACD you are looking for crossovers as the signal that its changing from bearish to bullish, or bullish to bearish.
When you get the all lining up it’s a considered a strong BUY or SELL signal. You still have to read the flow of whats happening. As in it was very unlikely to return back during yesterday with the dump on news.
You also have to look at 1m, 5m and 15m, 1h to see how it’s unfolding. As a small bullish run on the 1m or 5m, could be still part of a bearish trend etc
You can also have fun spotting patterns emerging to see if its looking bullish or bearish next.
I also prefer the heikin ashi candles which make it easier to see whats going on.
If only that 15 m chart was the monthly one 

blessing in a disguise. End of this month they will tell their quarter earnings and then after that in December they’ll sell their toys merchandise.
$1 I knew it!! 
Actually it’s at $0.99 now!!
International Launches “Kartoon Classroom!”, Featuring Animated Educational Content for Children As Brand Extension of Kartoon Channel!
Up nearly 4% today! Come on, come on!


