Hi i am new here and cant seem to find the 52 week high/low when looking at the shares chart can anyone help out ?
When you look at the 1 year price graph, the peak will be at the 52 week high, and lowest point will be about the 52 week low.
For the 53 week high/low, it is a bit more difficult. You’ll need to look at 2 years data which will be quite small on screen. Yahoo prices might be more scalable to read.
Hope that helps.


disappointing they dont have the standard 52 week high low also i can only get the chart to show one month 
1 Like
Cheers Mate but should not need to bugger off somewhere else to get it
You need to remember T212 aren’t charting trades on the chart unlike the Google or TradingView example.
T212 are plotting the ASK (buy price). In general it shouldn’t be too far off it.
For the bigger cap that have Reuter info you’ll find it under company info > all ratios

2 Likes
Whats wrong with using the expand the chart icon and selecting 1 week or 1 month? Seems to give all the information your asking for


Nothing wrong but two things.
You’ll need to look at candles, not line which averages it all out.
The second thing is the chart is just plotting the ASK.
So you don’t see what the highest someone actually paid, and you don’t really have an idea of the lowest trade. Just the lowest ask.
Ofcourse I just quickly loaded it up for an example
Yeah so the second issue, the charts are only showing the ask.

The candles are what is being asked.
Sorry I thought you said it doesn’t show the highs and the lows only the ask? It appears to show both
The charts in Invest/ISA are only showing what is being asked, the candles show the actual best asks, the line an average.
So for each candle you have O H L C
What was the ask when that time period started, what was the highest, what was the lowest and where did it finish.
We can only see 1m as the lowest unit, but it’s changing every second.
On the CFD mode you can flip the chart between them, it actually plots the BID by default, but you can flip to the ASK chart.
In any case what it doesn’t show is what someone actually paid or received from selling which is what they are trying to find.
So someone could be selling a car and asking £10,000 and I say I pay £9000 and not a penny more. Ok done.
The ask was £10,000. The trade was £9000.
A house could be selling at £400,000.
Two buyers both want it, one says £420,000 the other gets the deal done at £450,000.
So the ask was £400,000. The trade was £450,000
1 Like
I appreciate you know far more than me thats not in question but surely the price paid lows and highs would be reflected in the ask price or it would never change?
This is a learning expedition not an argument
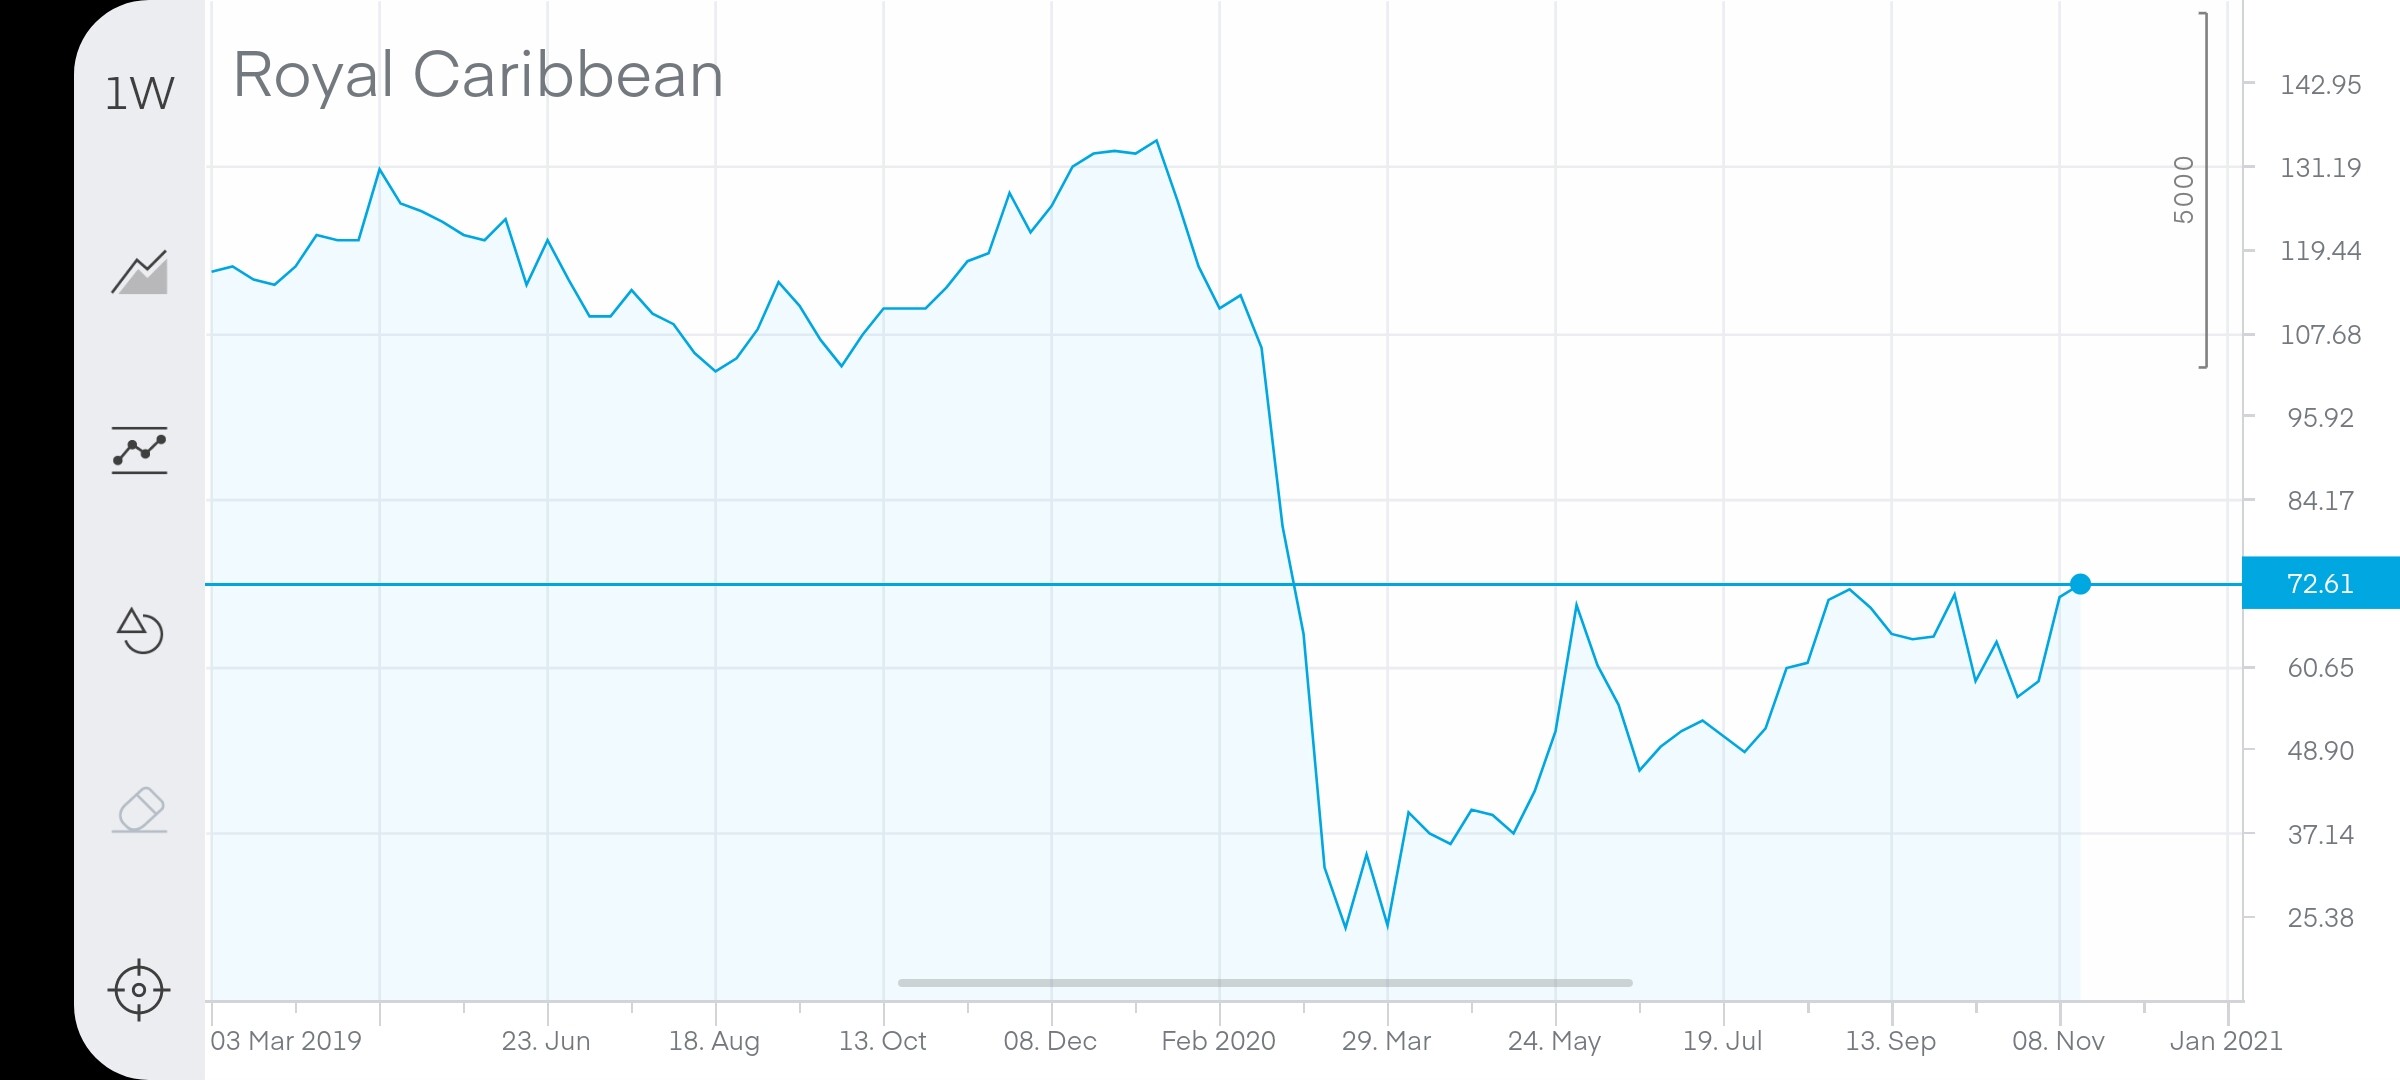
So if you took RCL as an example you could quickly pick the top and bottom buy price going back a year from now.
You’ll know that someone probably paid around that 140 and the bid probably would have been near to that the lowest ask around 19.
As I said there’s nothing wrong with using that as an estimate but it’s not the 52 week high/low.
So for T212 charting the ASK we see these as the highest offer and lowest.


However looking at actual trades you can see the highest trade took place 17th Jan.


1 Like
I see so this would show more about buy/sell price demand than the ask would is that correct?
Yeah so if you imagine what you see in invest/ISA is the purple line.
There’s a blue line which is the bid.
The black crosses are actual trades going on buying and selling.
Just a case of taking the highest and lowest.

If you are using T212s you aren’t looking at actual trades and you don’t have the bid to see where the selling was.

1 Like
So is the ask just suggesting the next bid?
I don’t currently trade I only buy but I think I’m going to invest some time in the charts before I do
You aren’t buying and selling with each other, you have a MM in the middle.
So you buy at the ask say 5, and the bid at the time might be 4.80, the spread is 0.2 which mostly goes to the MM for the service.
If enough demand is hitting that 5, the ask will be raised say to 5.10 and the bid would follow say 4.90. However its not always at that same 0.2 distance.

The spread is tighter when there’s less risk to the MM and wider on more volatile or illiquid. They are honoured to always be providing ask and bids to keep the market flowing.
When you have an ask of say 5.10 you could hit that ask paying the full 5.10, or it could be under/over depending on the demand.
The ASK (buy price) and BID (sell price) we see is what’s called the best, but if you look at the order book you can see what’s people are wanting to buy and sell at and at what size.
You then have time and sales which shows what people where actually buying and selling at.
1 Like