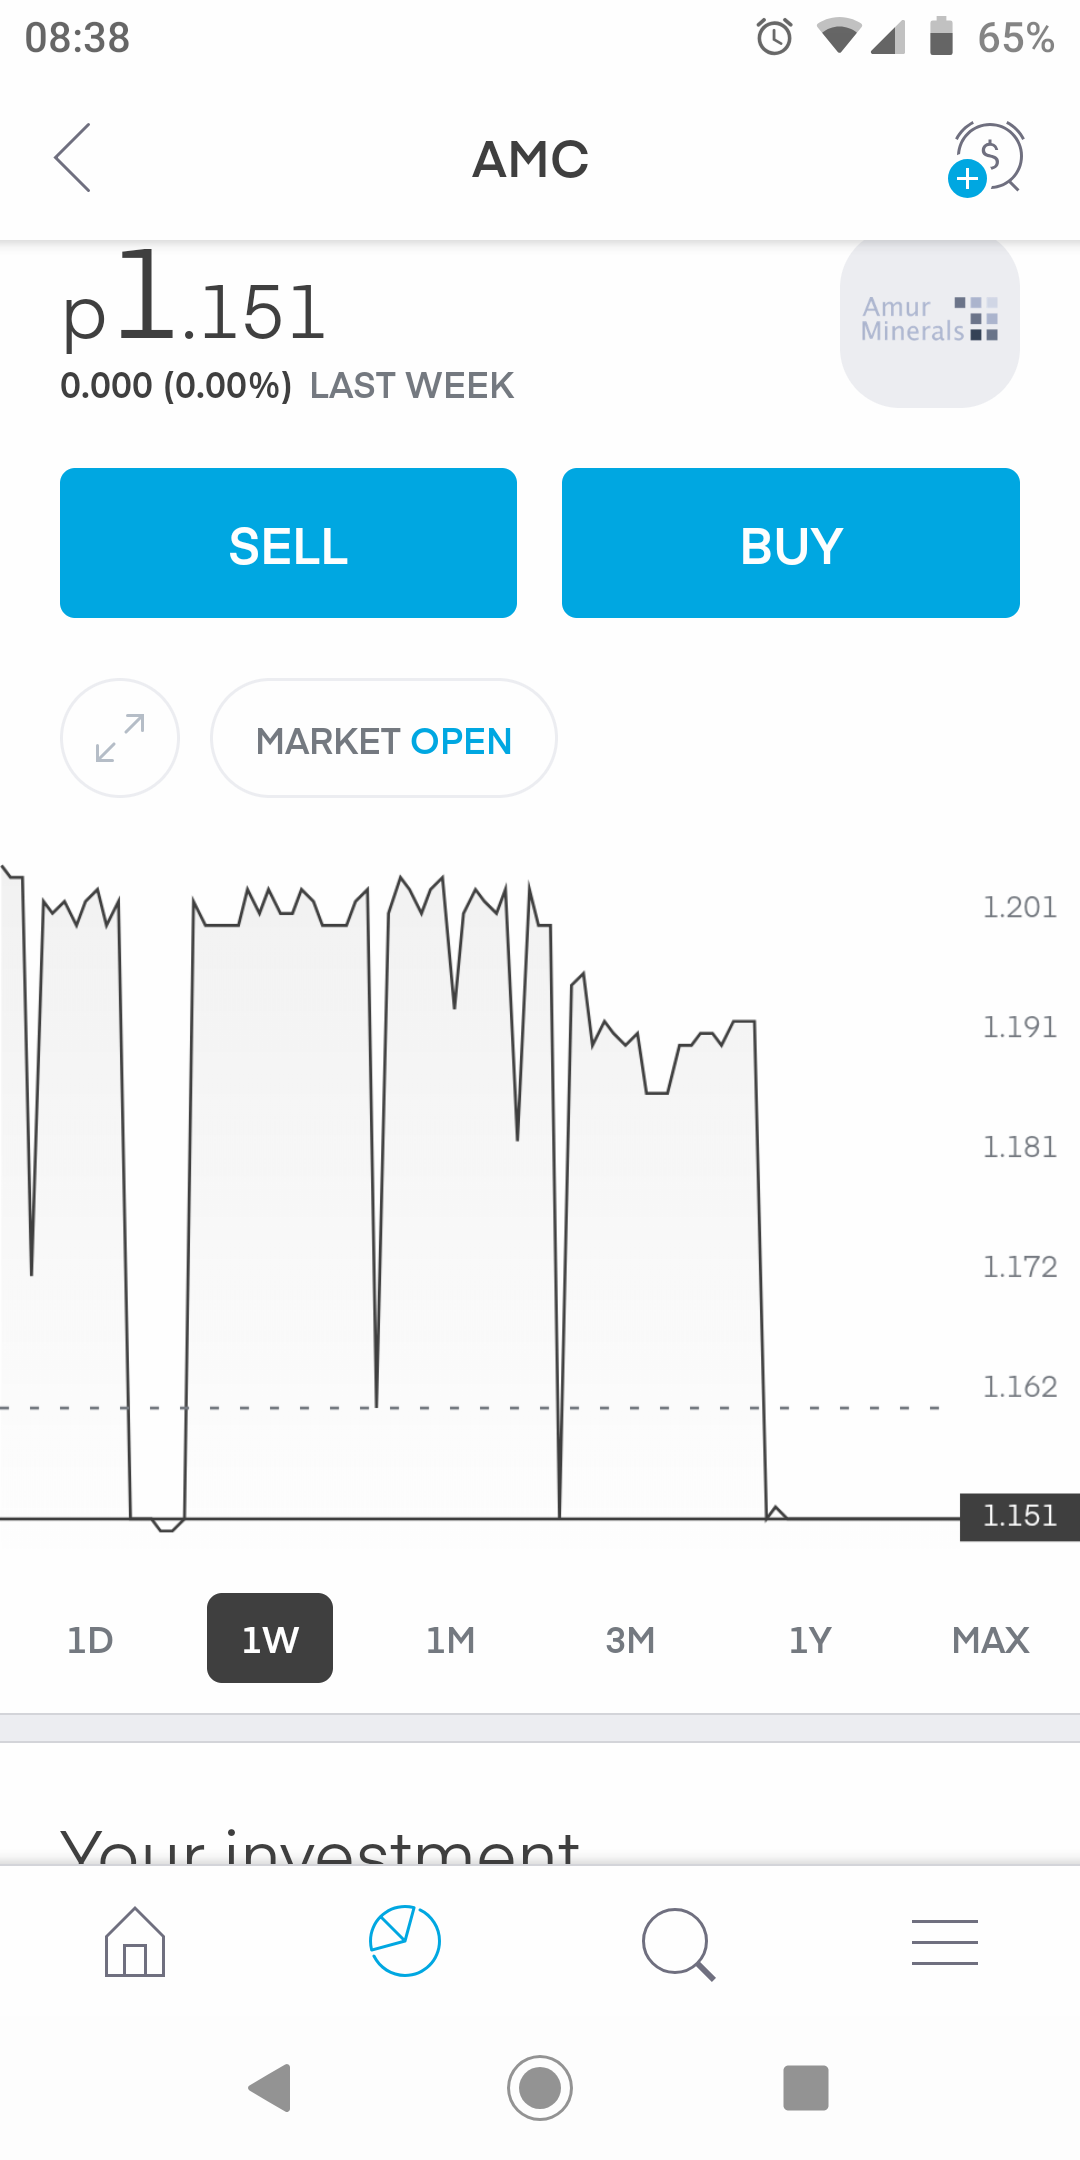
Looks like the chart has died of boredom.


Isn’t it showing like that because you are on a 1M chart. It looks about right given the spread etc
1M is one minute in both charts.
If you watch it in real time it’s just constantly pinging between 1.152 and 1.150.
If you watch Google stocks it’s showing between 1.15 and 1.14.
Seems tricky to actually trade this or am I being an idiot.
I must be missing something but the candles seem to be hitting broadly similar highs/lows. I don’t like 1M charts on shares like this because it just doesn’t work.
One minute definitely works on normal shares, its critical when day/swing trading to follow.
This is the first werid one I’ve dealt with, but there’s no steady movement either up or down, it’s just flicking about and the spread seems identical.
Rookie Q how are you meant to spot any patterns of where it’s going next when it’s like this?
On the week view you can see the gap missing from no data yesterday.
I dont really day trade so I can’t really say. I tend to just use 1H if I really want a short terms view, sometimes 4H but mainly I just use the daily chart because I am looking for longer term holds.
Having said that I do think the T212 charting package needs an upgrade (which I think they have acknowledged). If I wanted to do in depth and precise TA I tend to use IG.
Well just sold at a £6 loss as I can’t be dealing with this. My fault for leaving a limit buy when I didn’t want to buy. 
I’ve done that before too. Mine was a limit sell an the share continued to rise a lot further after the sell. Typical