How much commission does Trading 212 really charge? Please someone help me out as over the months I have become more baffled by the company.
Todays experience:
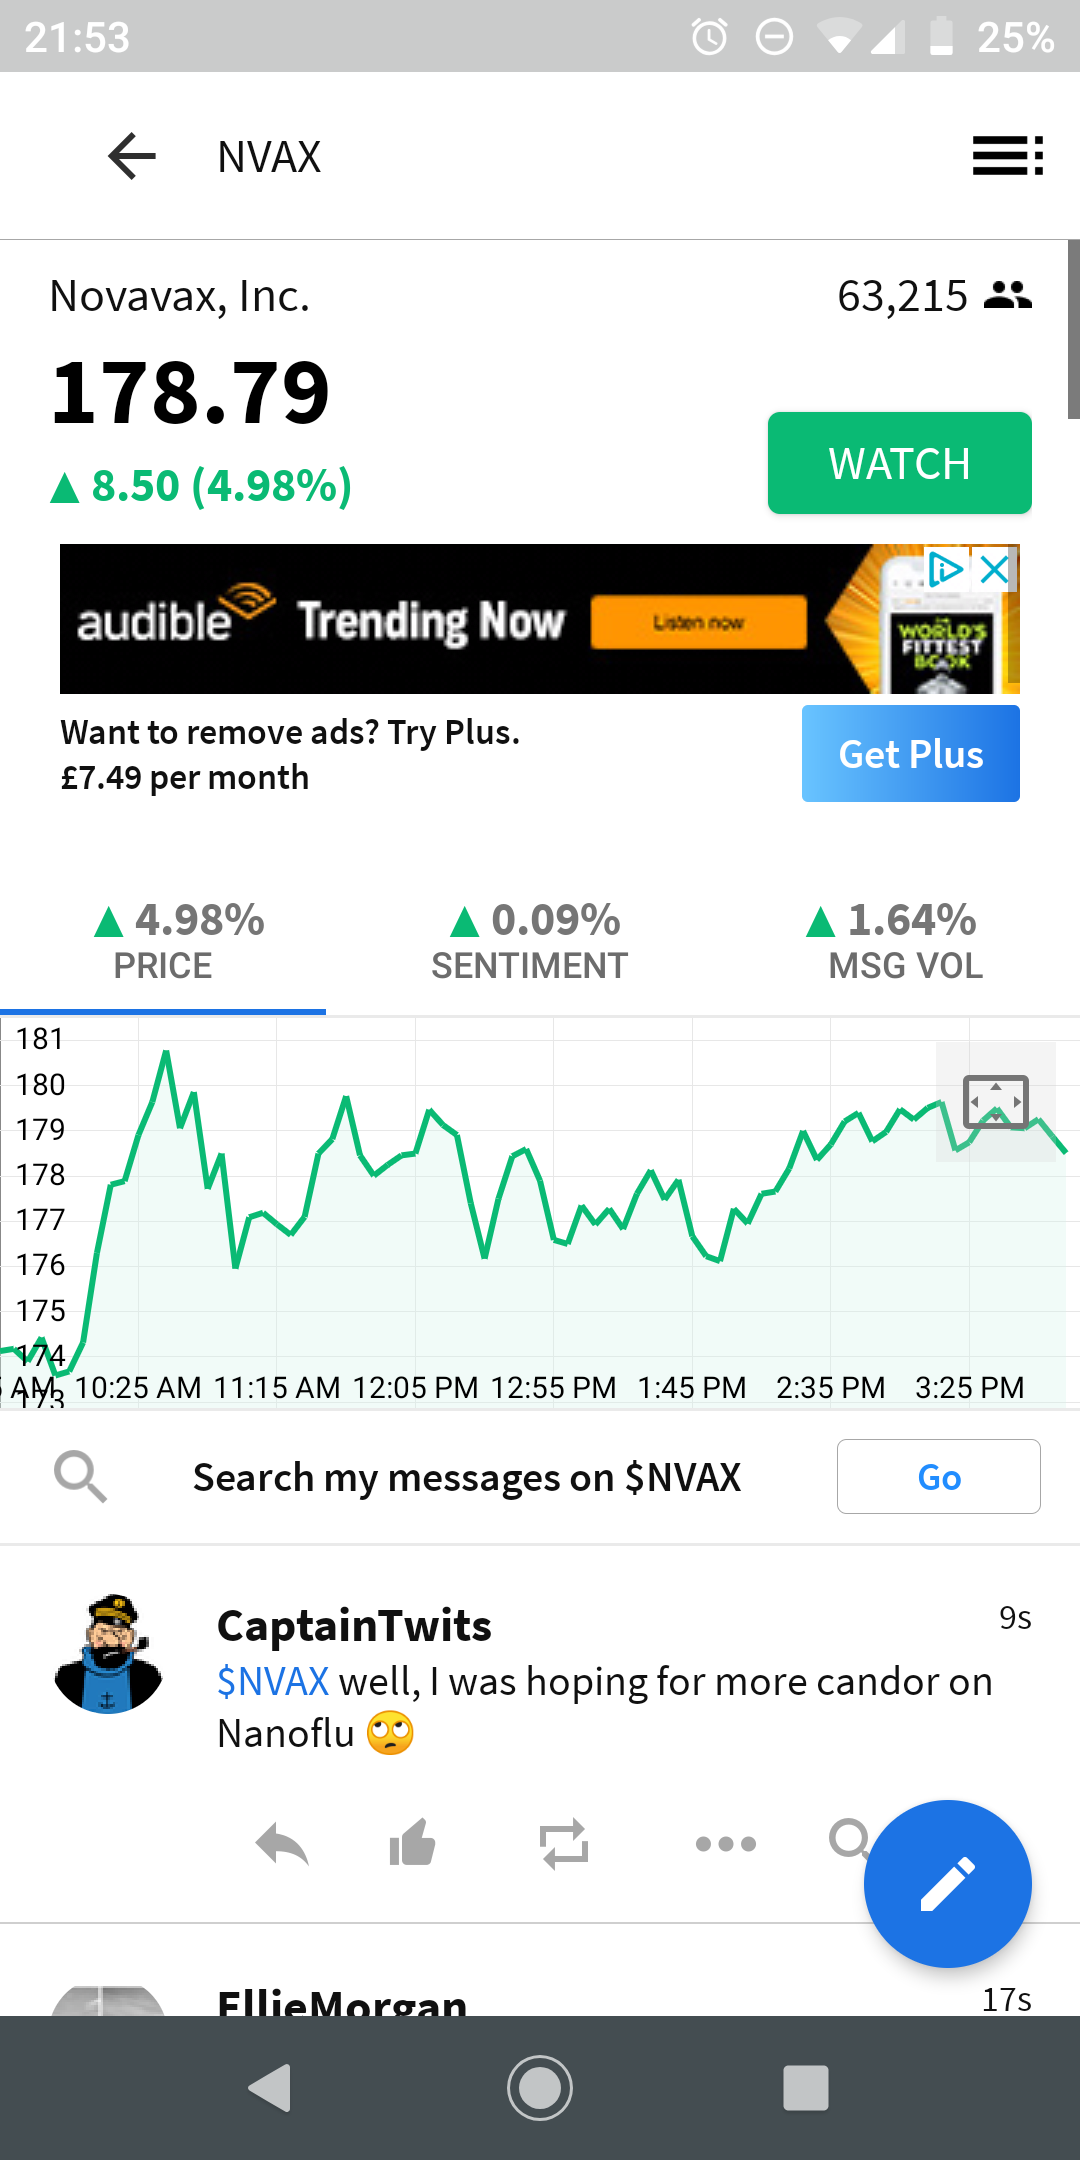
Account CFD: AM/Pre-Market NVAX priced as $172, Trading 212 Buy price was $177 ($5 dollars more per share!)… I’ve purchased NVAX before and paid an additional $0.30-$0.70 per share, and No this was Not the first 5-15 minutes of pre-market opening.
Account ISA: PLAY I purchased 95 shares at $15.02, price increased to $15.37 and showed in the Red by -£28.14!. I assumed Trading 212 platform was taking time to catch up, but not the case, the price increased and decreased and still fluctuated in the Red even though above purchase price.
If you have worked out how to navigate through this platforms prices please do let me know
PS: Please don’t ask me to try emailing customer service, i have already informed them about their list of Extended Trading hours being inaccurate, and had 5 staff members tell me otherwise (still shows on the website with inaccurate extended hours 1 month+ later).
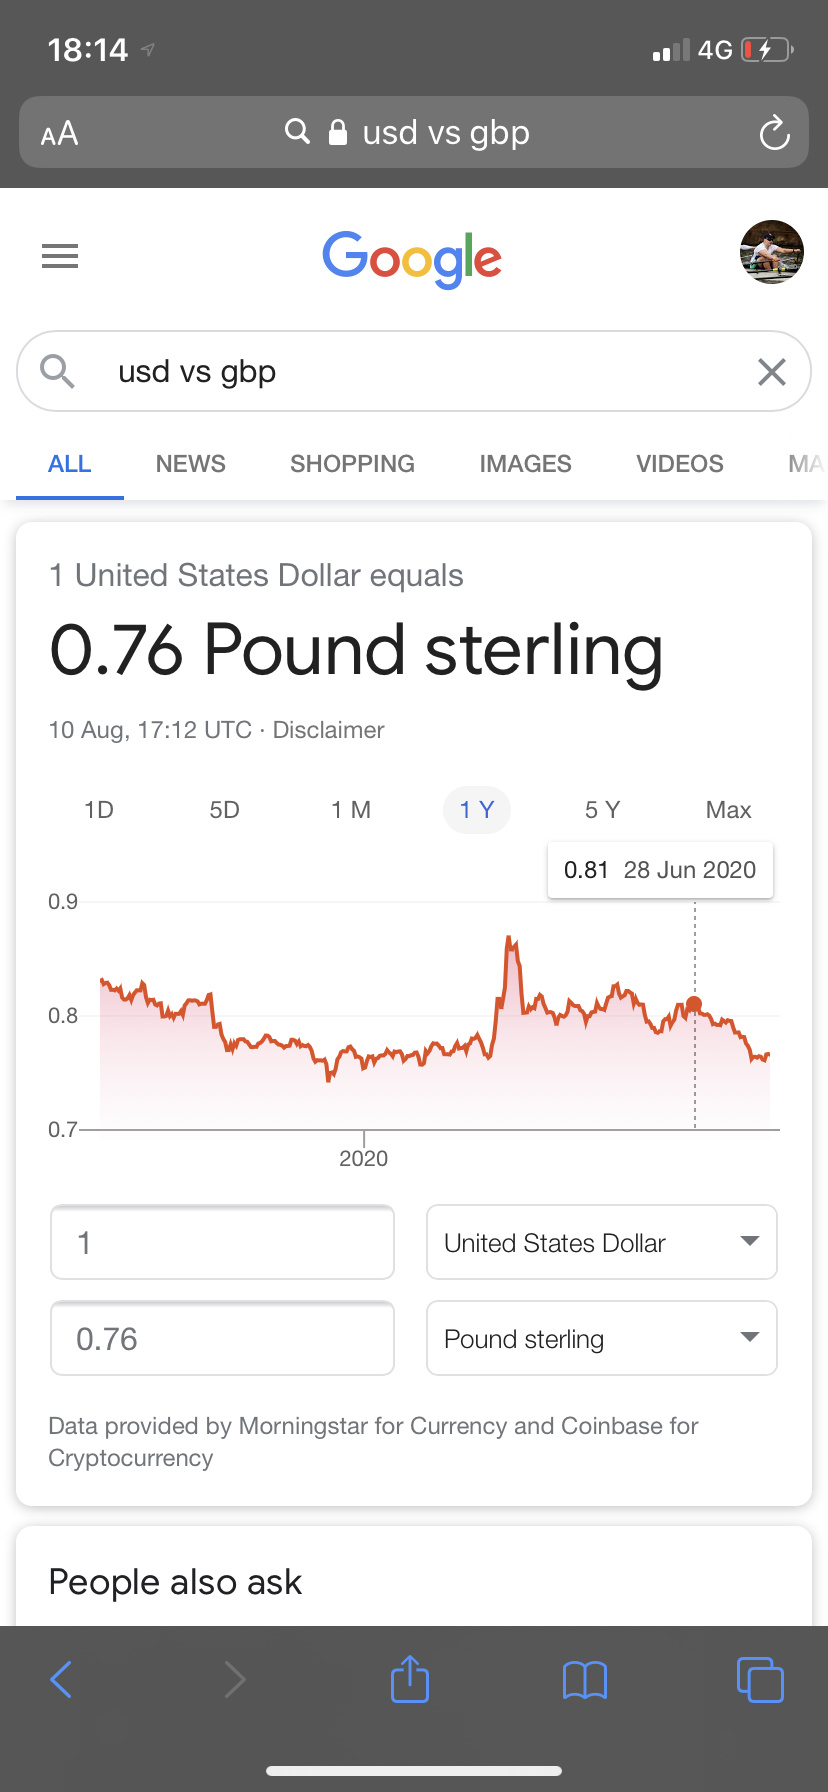
Hi Richard, thank you for replying, would that make such a difference to the price? i thought about it but don’t trade currency so wasn’t sure of the impact.
This needs to be pinned to the top of the forum. Every couple of days somebody has the same issue!
@Hectares for the most part, people who experience this problem find it is indeed a decline in dollar strength. Keep an eye on the exchange rate between GBP and USD and see does this affect your pricings.
Thank you for replying Alien. UK time approx from 9am-9:40. I logged in and out a few times as the T212 Chart price, Buy/Sell purchase box, and yahoo were all showing different prices. I didn’t purchase due to the price difference.
For CFD there is a spread. - diff between buy and sell price.
When you bought a stock and you want to close the position, you actually need to look at SELL price. Same goes for selling the stock, you need to look at the BUY price.
Thank you for the screen shot, there’s a difference in value for sure. i’m baffled why it didn’t effect my GRPN shares/profit which were purchased the same dates as PLAY shares (i sold GRPN on Friday).
Thank you for replying Sven, I done so which is why i didn’t purchase as the Sell was showing as the chart price, and the Buy price was showing $5 extra.
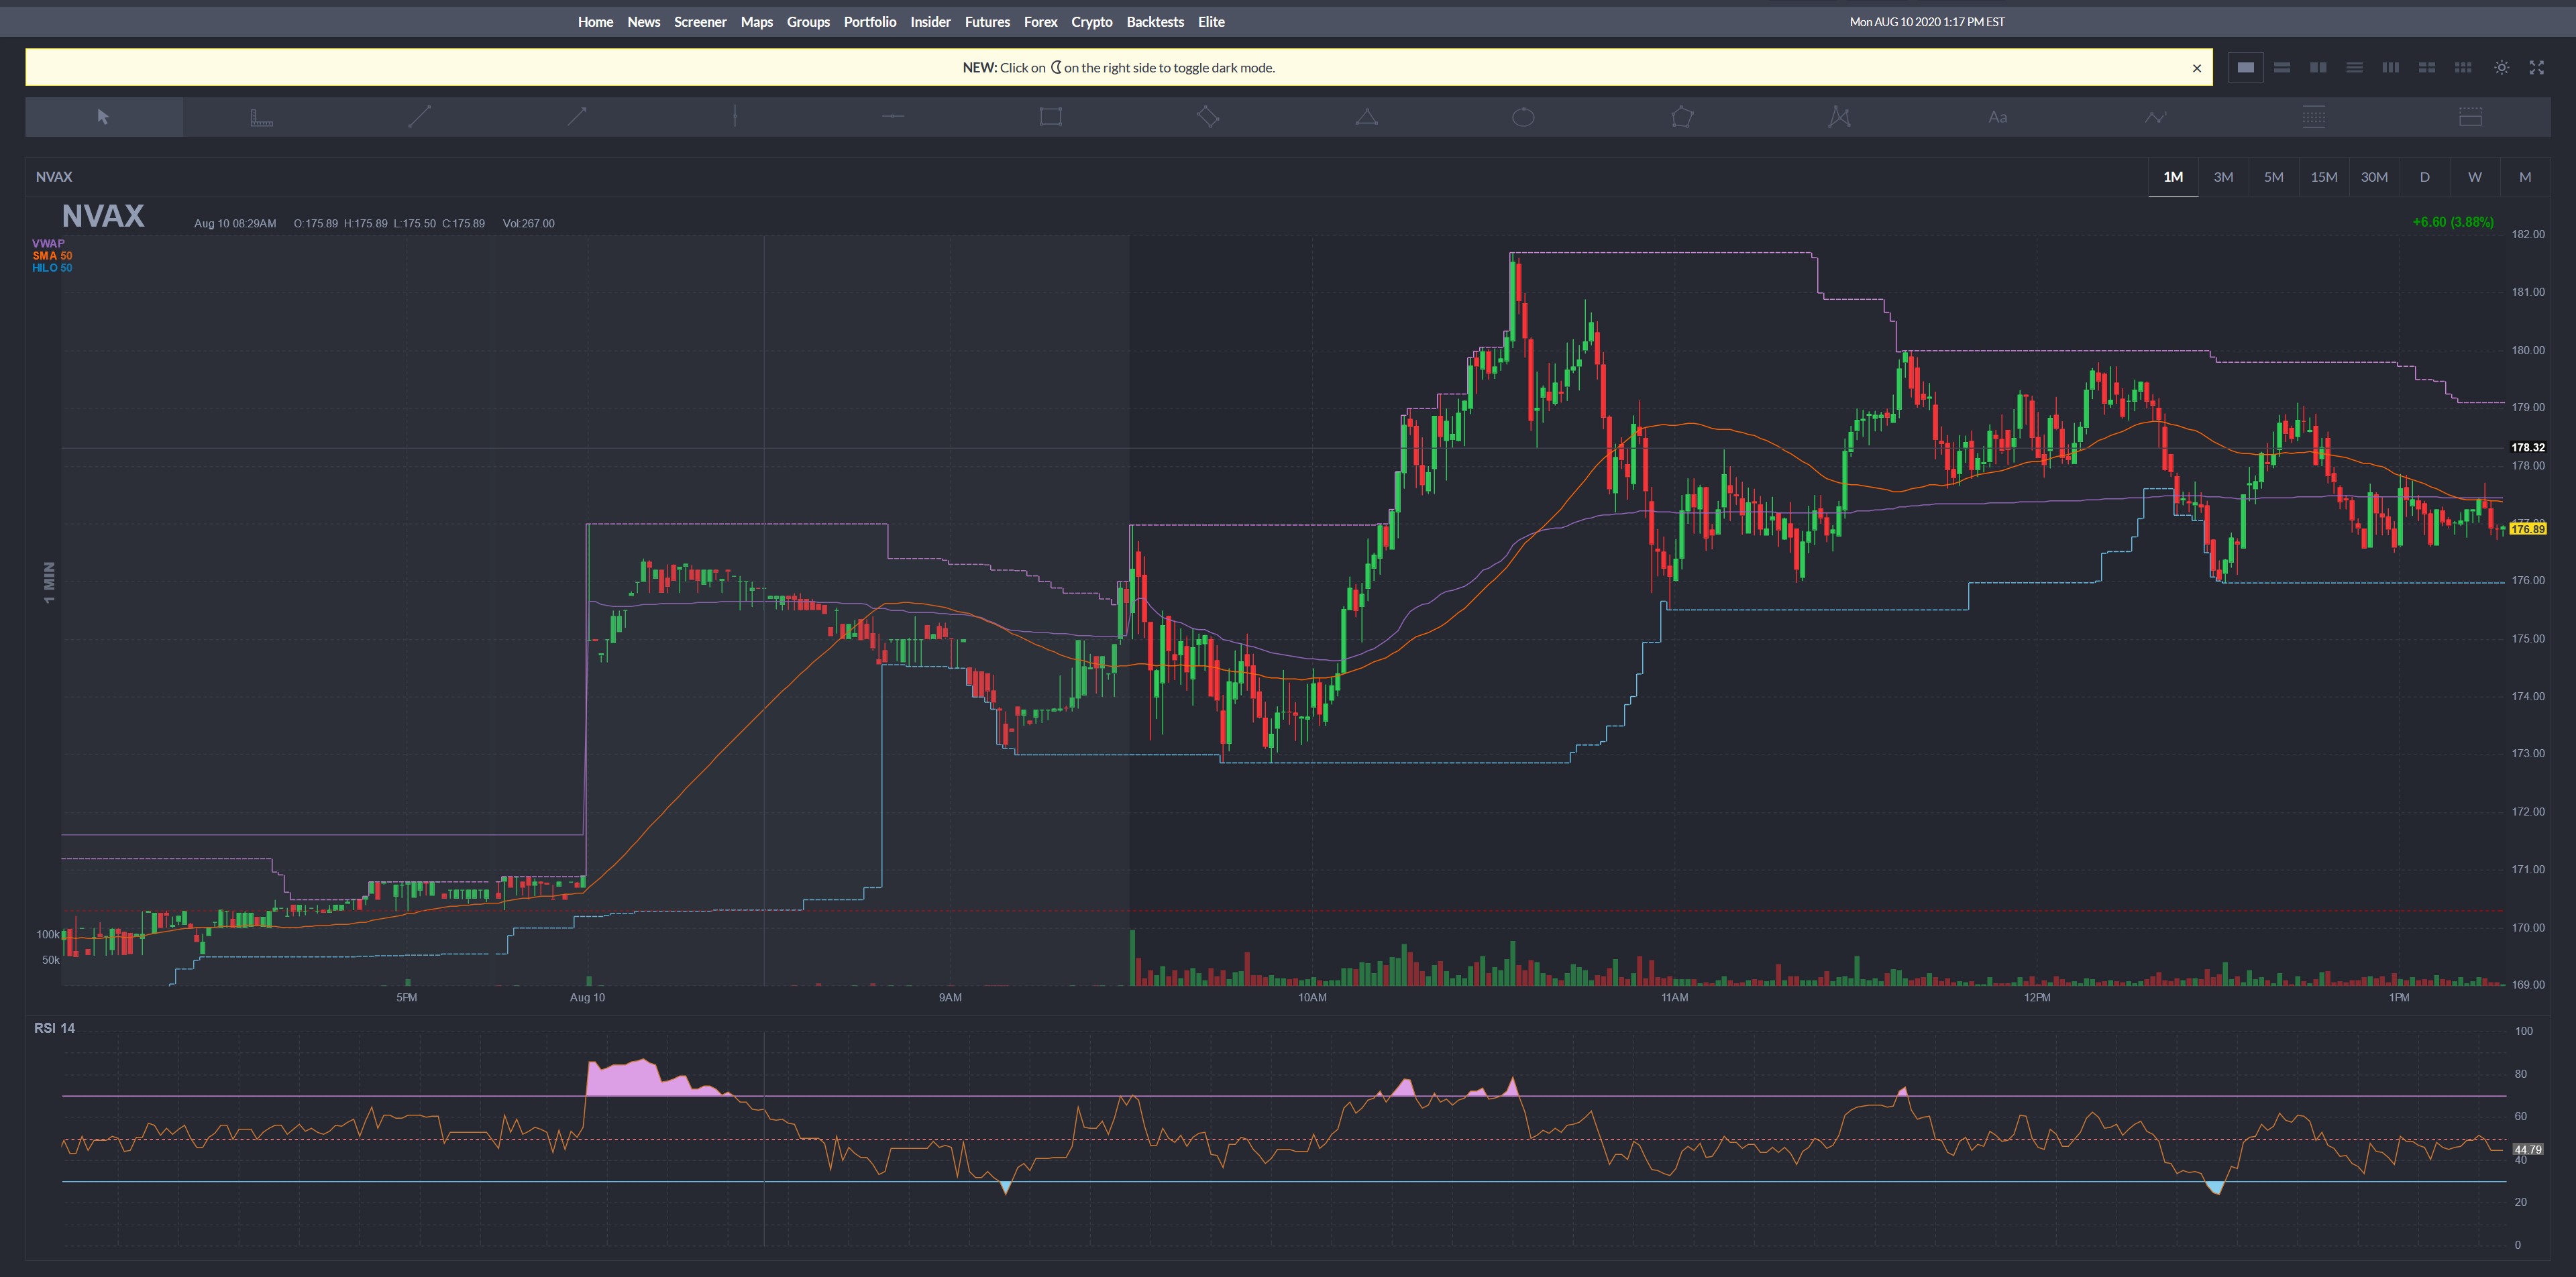
Thank you for the screen shot Alien, unfortunately that is not the true reflection of this morning, as i was staring at the live chart at the time.
When in the CFD chart, there will be a price line which indicates the Live price. this Was displaying as $172, along with the Sell price, anyone who was trying to trade NVAX pre-market would have likely experienced the same visual. please bare in mind this is not the first time i’ve experienced T212 requesting a higher than normal CFD price, the same occurred with AAPL the day the stock split was announced, the live chart price got stuck on a certain price, along with the Buy price being dollars more than the Sell price, and Yahoo/Google.
If you’re new to the CFD platform in time you’ll experience the same, its a regular occurrence
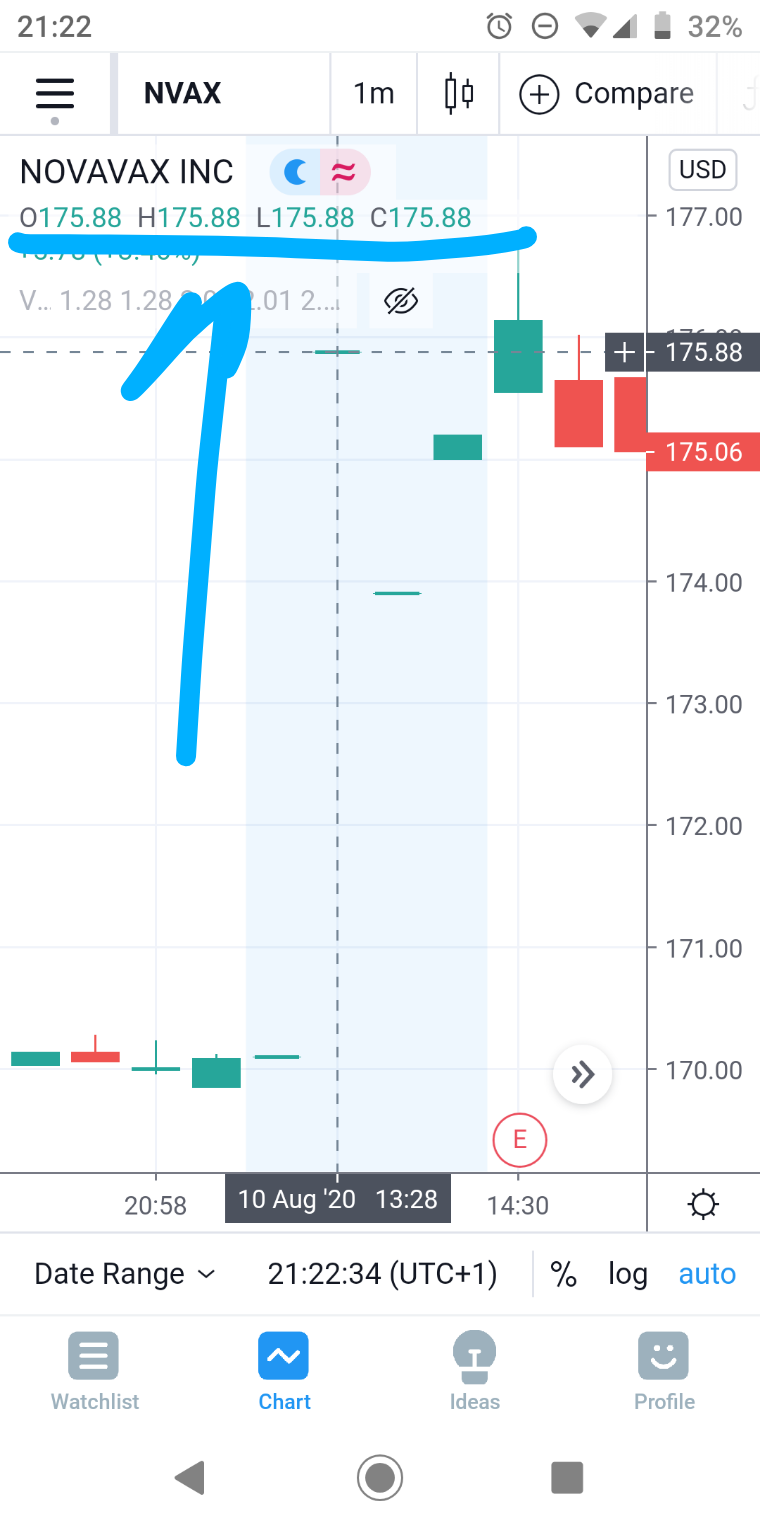
Sorry I didn’t make it clear. The chart I uploaded is the real time market feed not T212 chart. The closing price on Friday was around $170.90, but when the pre-market opened it was around $175.
I think you are referring to the extended trading hours when the price reflects expectations rather than actual trading.
Thank you Alien, i think i understand what you mean now, so friday’s After-Hours price went to $175 which is why it was showing as the Buy price at pre-market?
Which would mean the chart indicator was stuck on fridays after-hours price before it reached the closing price of $175, because as stated it was showing as $172 during pre-market.
Extended hours isn’t expectation, it is the price people are Buying/Selling shares for.
Thank you for replying Phil, that’s what i originally thought regarding todays opening price, but no the price was $5 difference between Buy and Sell, its more likely as Alien said being the closing price was $175 after-hours friday, and T212 hadn’t caught up…
Unfortunately Trading view charts are time delayed unless going pro? and don’t reflect extended hours movement in their charts?, but shows the extended hours price, in the price box on the right (when using a laptop).
BID/ASK price i’m not familiar with its impact. I will look into Bid/Ask/Level 2 more so i can understand if this was the reason, and/or currency changes, thanks Phil.
No the sell price was £15.36, i was using my ISA, but i would have lost £28.14 so i’ve kept the shares.